
Customer Success Dashboard Template
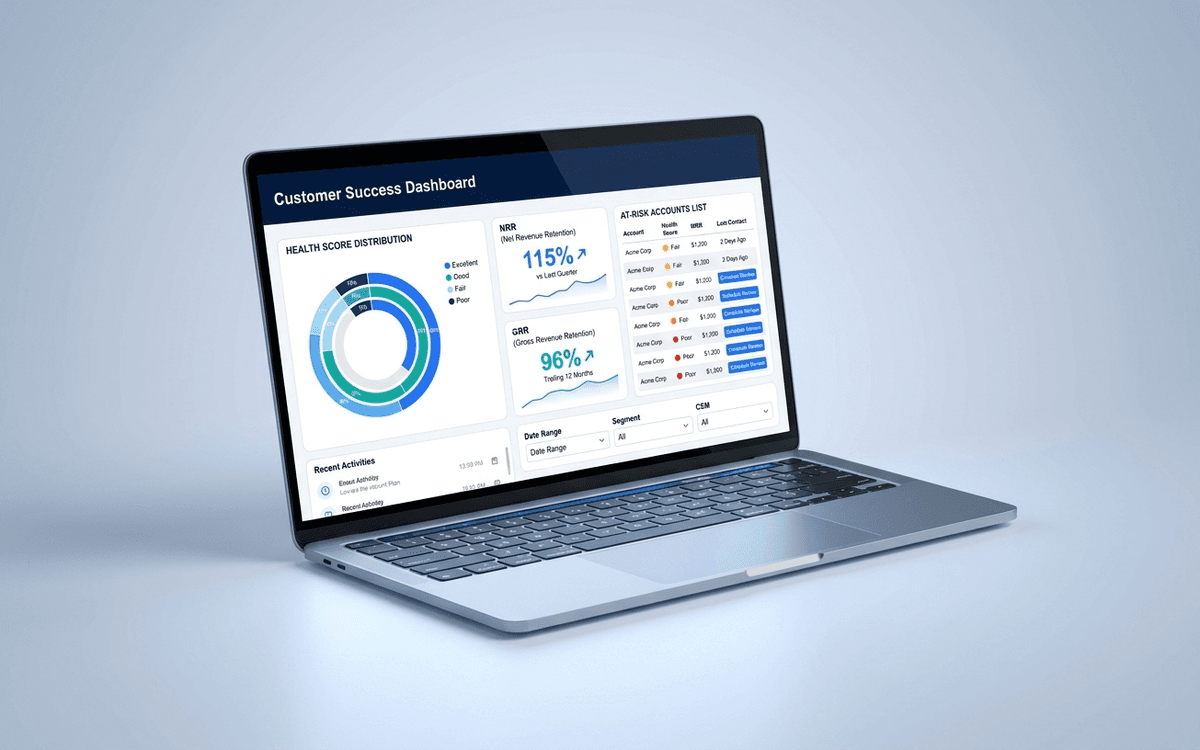
A customer success dashboard template that tracks what CS leaders actually run the team against — health score distribution, net and gross retention, expansion pipeline, at-risk accounts, and CSM book of business — in a weekly review format.
Download this template — free
Tell us where to send the link. We'll never share your email.
What's included
- Health score distribution (green / yellow / red counts)
- Net Revenue Retention (NRR) and Gross Revenue Retention (GRR)
- Expansion pipeline by stage
- At-risk accounts list with reason codes
- CSM book of business — accounts, ARR, risk score
- Onboarding funnel (signed → kicked-off → live → adopted)
- Time-to-value (signature → first measurable outcome)
- Logo retention trend
- NPS / CSAT trend
- Source data on a separate tab
How to use this template
1. Define health score before measuring it
A health score that everyone interprets differently is worthless. Lock the definition: which signals count (product usage, support tickets, engagement, sentiment, payment), how they're weighted, and what the green/yellow/red thresholds are. Re-calibrate yearly, not monthly.
2. Track both gross and net retention
Net Revenue Retention (with expansion) can hide churn. Gross Revenue Retention (without expansion) catches it. Best-in-class SaaS: GRR ≥ 90%, NRR ≥ 120%. The gap between them is your expansion strength.
3. Surface at-risk accounts WITH a play
A list of at-risk accounts without a play is just bad news. Every at-risk account on the dashboard gets a reason code (low adoption / executive sponsor change / billing dispute / competitive) and an owner running an explicit save play.
4. Track time-to-value, not just onboarding completion
Marking onboarding "complete" when the customer goes live tells you nothing. Track time-to-FIRST-VALUE (the first measurable outcome the customer cares about). That's the metric that predicts retention. Companies that achieve early time-to-value retain dramatically better.
5. Review weekly with the CSM team
A CS dashboard reviewed quarterly is decorative. Weekly review with the team present catches at-risk accounts early — when intervention is still possible. Schedule the review, keep it tight, and exit with explicit save-play assignments on every red account.
Who it's for
- VPs of Customer Success building the function
- CSM team leads running weekly account reviews
- COOs taking customer success ownership at small companies
- Boards asking about post-sale health
Frequently asked questions
- What's NRR (net revenue retention)?
- NRR = (Starting MRR + Expansion − Contraction − Churn) / Starting MRR. Measured monthly for a 12-month cohort. Above 100% means existing customers are net expanding — even before new customer acquisition. Best-in-class SaaS hits 120%+; the elite hit 130%+.
- How do I build a customer health score?
- Pick 4–6 signals that predict retention: product usage, executive sponsor engagement, support ticket trend, NPS/CSAT, billing status, and adoption breadth. Weight them, define thresholds, score monthly. Validate the score against actual churn — your initial weights are almost certainly wrong, and that's fine.
- When should a CS team get involved?
- From day zero of the sale, ideally — though many companies wait until kickoff. Companies with the strongest retention bring CS into late-stage sales calls so the post-sale handoff is seamless. The single biggest lever on NRR is the first 90 days post-sale.
- What's a healthy CSM-to-customer ratio?
- Depends on ACV. High-touch (ACV >$100K): 10–20 accounts per CSM. Mid-touch (ACV $25–100K): 30–60 accounts. Low-touch (ACV <$25K): 100+ accounts, often pooled tech-touch. Wrong ratio is the most common reason CS teams underperform — too many accounts and CSMs become reactive.
- When do we outgrow Excel for CS dashboards?
- When you have 50+ accounts, when health score signals come from 3+ systems, or when CSMs need a live shared view of their book. Gainsight, ChurnZero, Catalyst, Vitally, and Totango are the common dedicated CS platforms.
More customer success templates
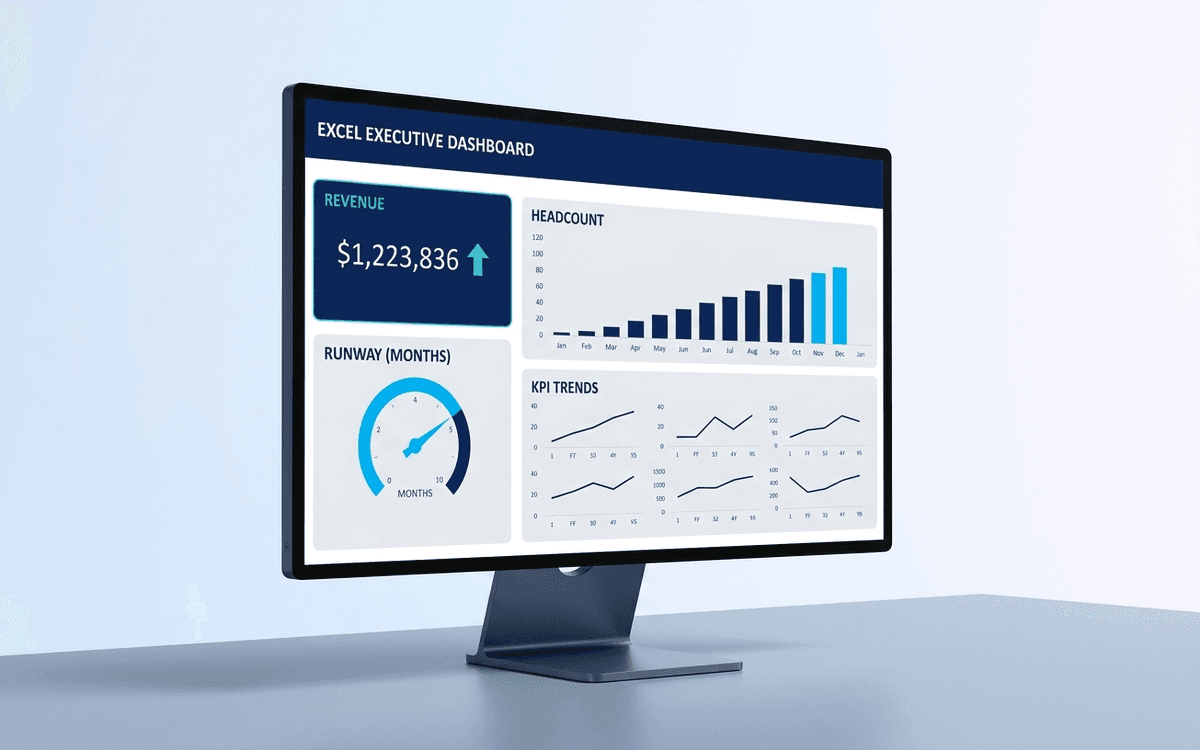
Executive Dashboard Template
An executive dashboard template gives leaders a one-page view of what actually matters — revenue, runway, headcount, and customer health — with the formulas and chart structure already built so you spend zero time formatting and all your time on the conversation.
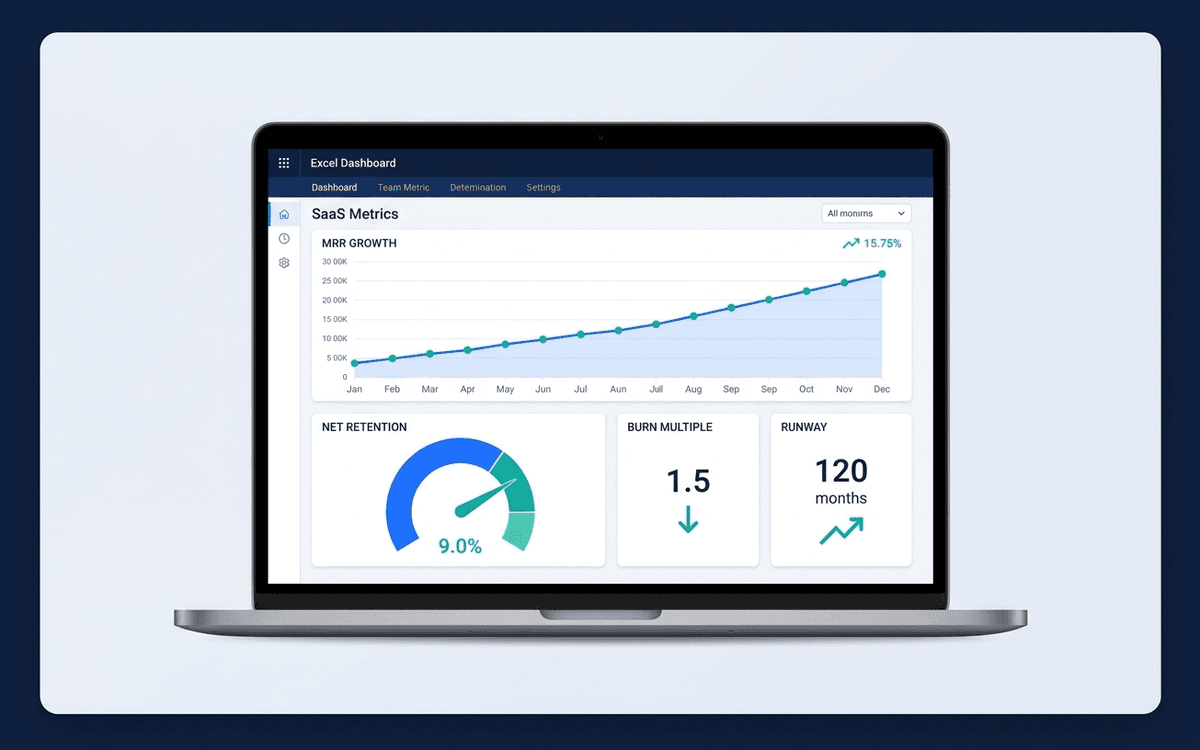
Startup Metrics Dashboard Template
A startup metrics dashboard template covering the SaaS metrics that actually move the needle — MRR/ARR growth, net retention, burn multiple, magic number, runway — in the format investors expect to see in board meetings and updates.
When the template isn't enough
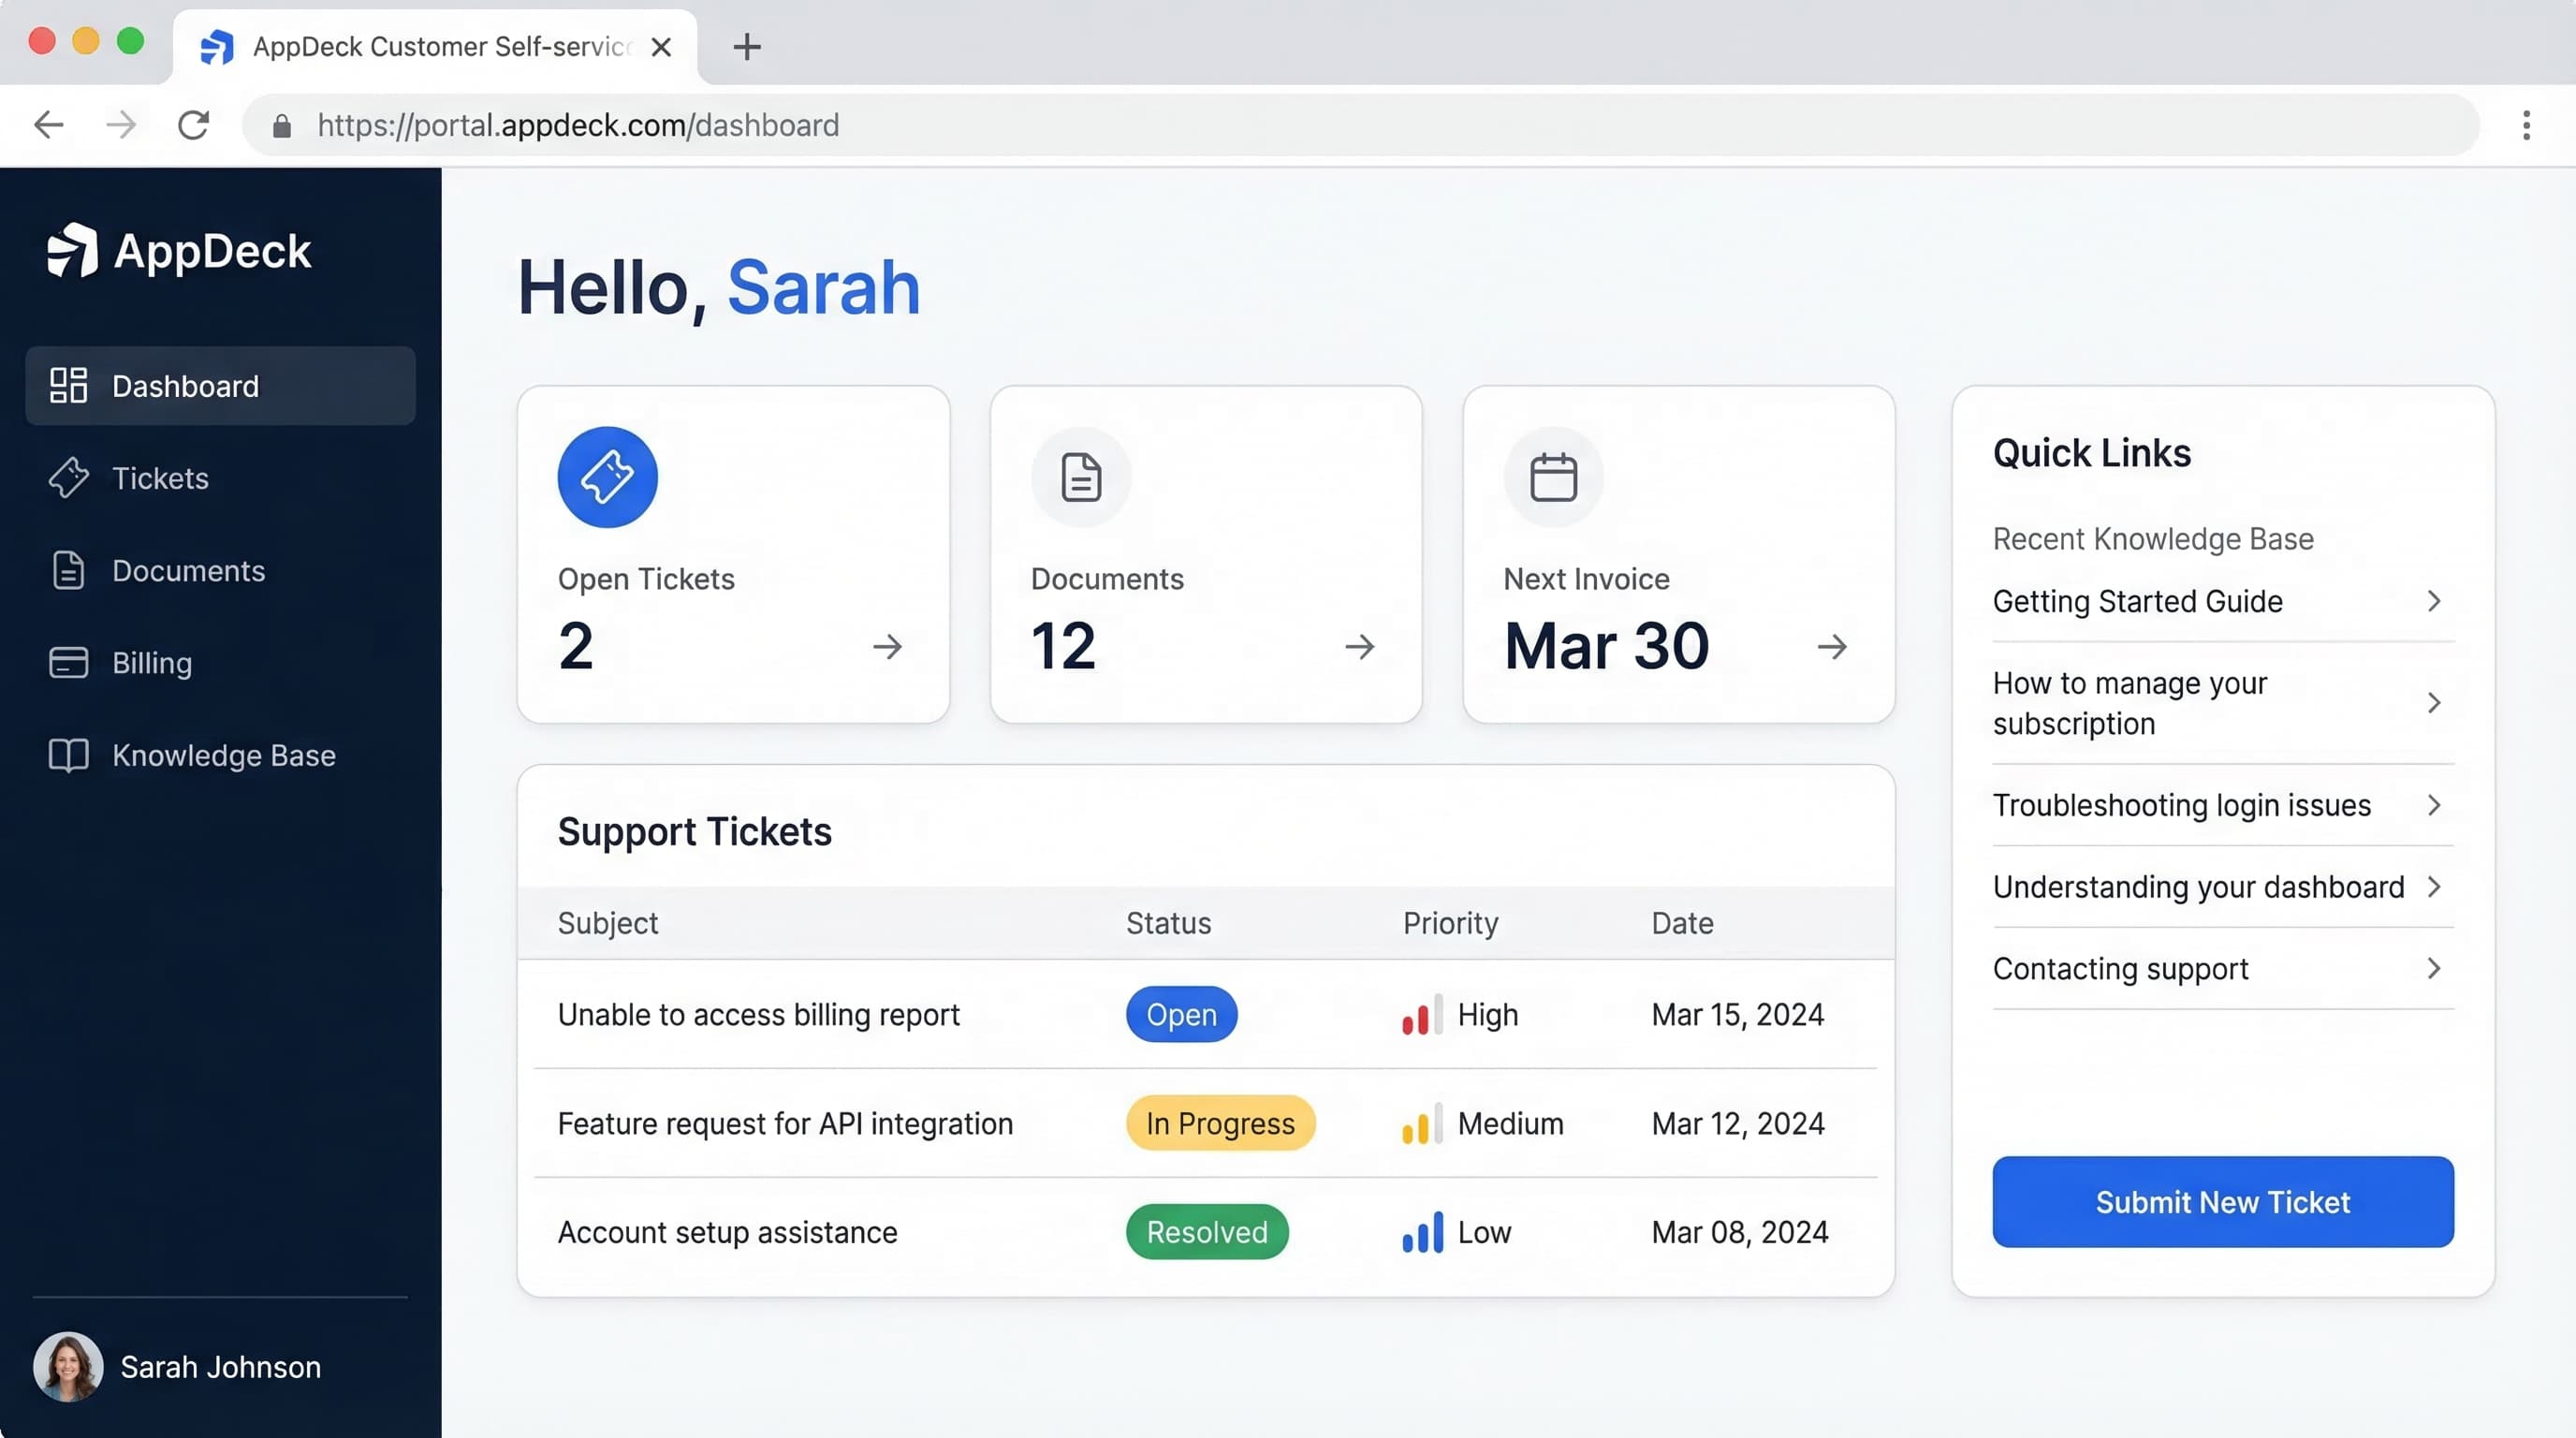
AppDeck's customer success portal turns this template into a live workspace — version control, permissions, signatures, and analytics built in.
Related Articles
Learn more about this topic from our expert guides and resources.
Customer Portal Examples: 15 Real-World Designs That Drive Adoption
15 customer portal examples from SaaS, e-commerce, healthcare, finance, and professional services. See what works, key features, and design patterns that boost self-service adoption.
Read ArticleHow to Reduce Support Tickets by 40% with a Customer Portal
Proven strategies to reduce support ticket volume using self-service customer portals. Knowledge bases, account management, billing portals, and automation tactics.
Read ArticleCustomer Portal Software Comparison 2026: 10 Best Platforms Reviewed
Compare the best customer portal software for 2026. Zendesk, Salesforce, Freshdesk, AppDeck, and 6 others reviewed. Features, pricing, and ratings.
Read Article