
Startup Metrics Dashboard Template
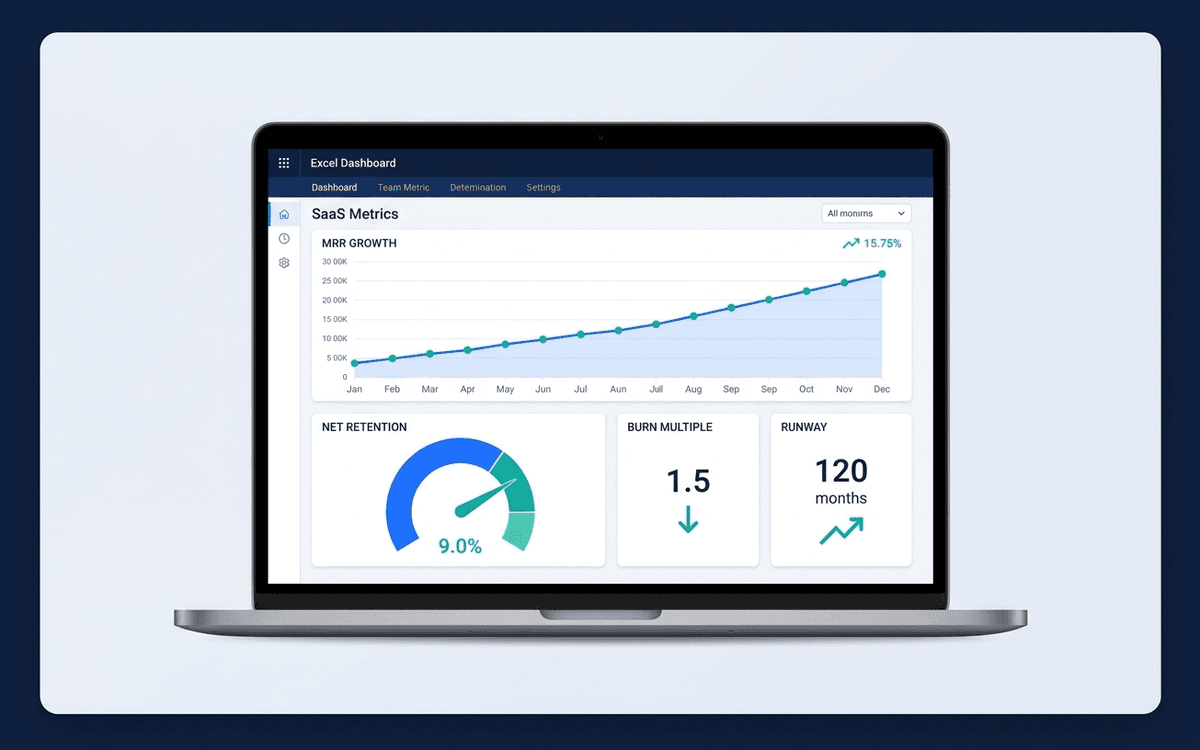
A startup metrics dashboard template covering the SaaS metrics that actually move the needle — MRR/ARR growth, net retention, burn multiple, magic number, runway — in the format investors expect to see in board meetings and updates.
Download this template — free
Tell us where to send the link. We'll never share your email.
What's included
- MRR/ARR with month-over-month and year-over-year growth
- New / expansion / contraction / churned MRR decomposition
- Gross retention and net retention
- Burn rate and burn multiple (net new ARR / net burn)
- Magic number (net new ARR × 4 / S&M spend)
- Rule of 40 (growth % + profit margin)
- CAC, LTV, CAC payback months
- Cash on hand and runway
- Source data on a separate tab
How to use this template
1. Get the MRR decomposition right first
New MRR + Expansion MRR − Contraction MRR − Churned MRR = Net new MRR. Every other SaaS metric depends on this being right. Many startups get this wrong by mixing one-time payments into recurring, or by counting downgrades as churn instead of contraction. Spend an hour getting the decomposition clean before building everything else.
2. Report gross AND net retention
Net retention (which includes expansion) can mask churn. Gross retention (customers retained, not dollars) catches it. Both belong on the dashboard. Best-in-class SaaS shows net retention above 120% with gross retention above 90%.
3. Add the burn multiple — investors care
Burn multiple (net burn / net new ARR) is the single most-quoted SaaS metric in 2024–2026 investor conversations. Under 1.0 is best-in-class; 1.0–2.0 is healthy; over 3.0 is concerning. Track it monthly so you see drift before the board meeting.
4. Calculate magic number quarterly, not monthly
Magic number = (current quarter ARR − prior quarter ARR) × 4 / prior quarter S&M spend. Monthly magic numbers are noisy because S&M spend doesn't pay back in the same month. Compute quarterly; report quarterly.
5. Connect to your CRM and accounting at month-end
Dashboards drift from the source quickly. Build a monthly close ritual: pull MRR data from your billing system, pull spend from accounting, reconcile against the GL, then update the dashboard. Same day every month. Without this discipline, the dashboard becomes plausible but wrong.
Who it's for
- SaaS founders preparing the monthly investor update
- CFOs building the board pack
- Operators getting ready for a Series A or B raise
- Boards wanting standardized SaaS visibility
Frequently asked questions
- What's the difference between MRR and ARR?
- MRR (Monthly Recurring Revenue) is the monthly view; ARR (Annual Recurring Revenue) is MRR × 12. Use MRR when most contracts are billed monthly; use ARR when contracts are annual or multi-year. SaaS companies typically report whichever matches their primary billing cadence.
- What's a healthy burn multiple?
- <1.0x is best-in-class — efficient growth. 1.0–2.0x is healthy and what most well-run SaaS companies achieve. 2.0–3.0x suggests inefficient growth that may need correction. 3.0x+ requires a strategy conversation. Burn multiple has displaced "growth at all costs" as the dominant 2024–2026 metric.
- What's a good net retention rate?
- Best-in-class B2B SaaS achieves 120%+ NRR. Healthy is 100–120%. Below 100% means existing customers are shrinking faster than they're expanding, which is a serious problem if you're also trying to grow. The "Rule of 40" companies almost always have NRR above 110%.
- What's the Rule of 40?
- Growth rate (%) + Profit margin (%) ≥ 40. A SaaS company growing 60% at -20% margin = 40 (Rule of 40 compliant). A SaaS company growing 20% at 20% margin = 40 (also compliant). The rule was popularized by Brad Feld and is the most common single number used by SaaS investors to triangulate company health.
- When should we move off this template to a real platform?
- When you have 3+ data sources (billing system, CRM, accounting, HRIS), or when finance + RevOps need shared live access, or when monthly maintenance takes >2 hours. Mosaic, Pry, Pulley's Carta integration, ChartMogul, and Maxio (formerly SaaSOptics) all replace the spreadsheet.
More dashboards templates
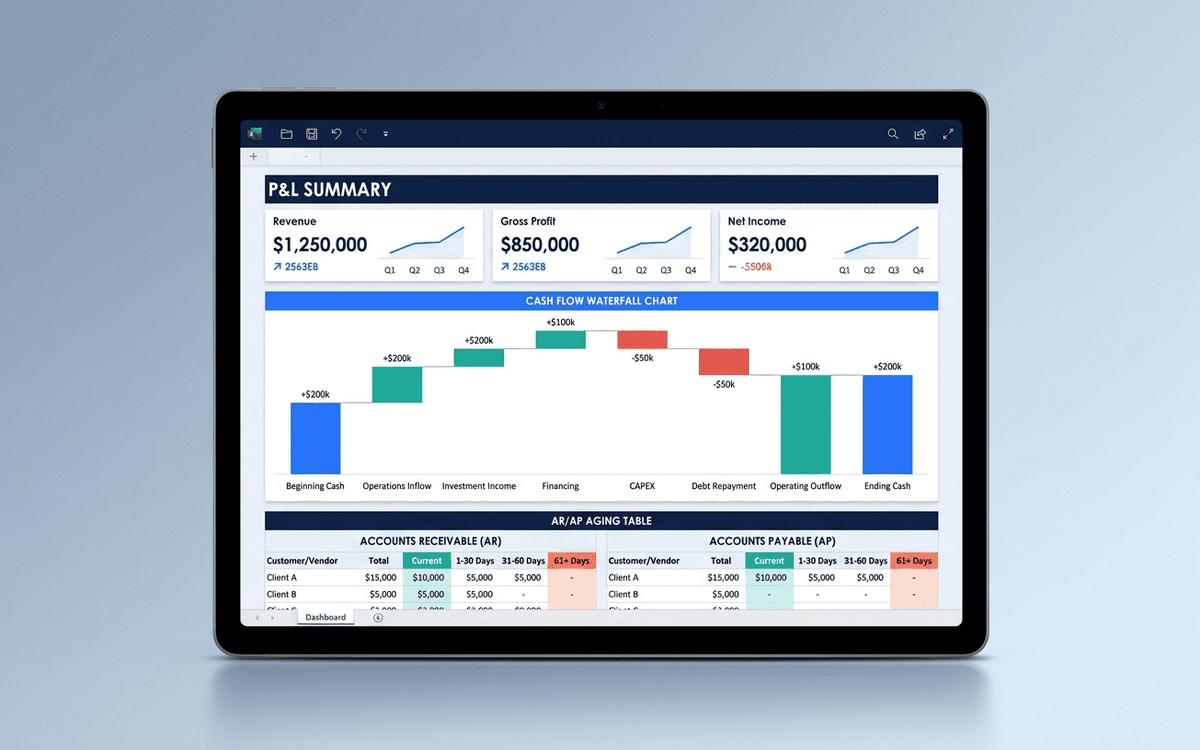
Financial Dashboard Template
A financial dashboard template that summarizes the P&L, cash flow, balance sheet, and key ratios in one page — built for the monthly finance review, ready to drop into a board pack, and small enough that a non-finance executive can actually read it.
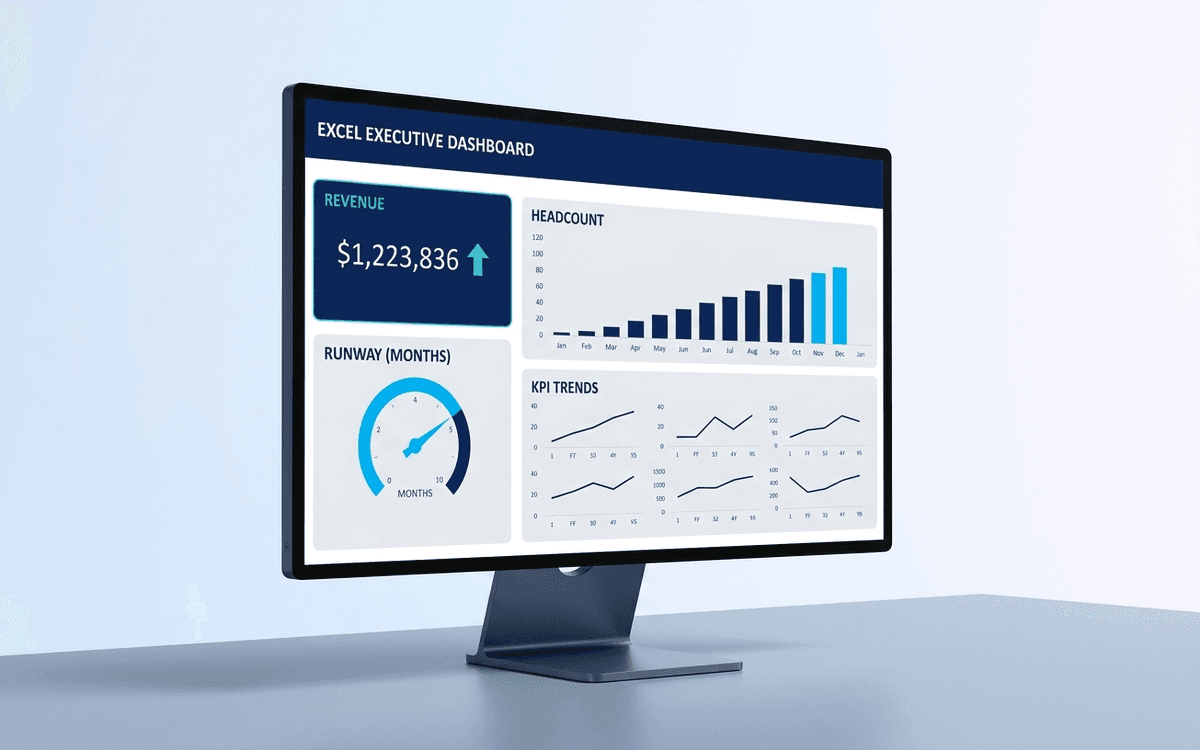
Executive Dashboard Template
An executive dashboard template gives leaders a one-page view of what actually matters — revenue, runway, headcount, and customer health — with the formulas and chart structure already built so you spend zero time formatting and all your time on the conversation.
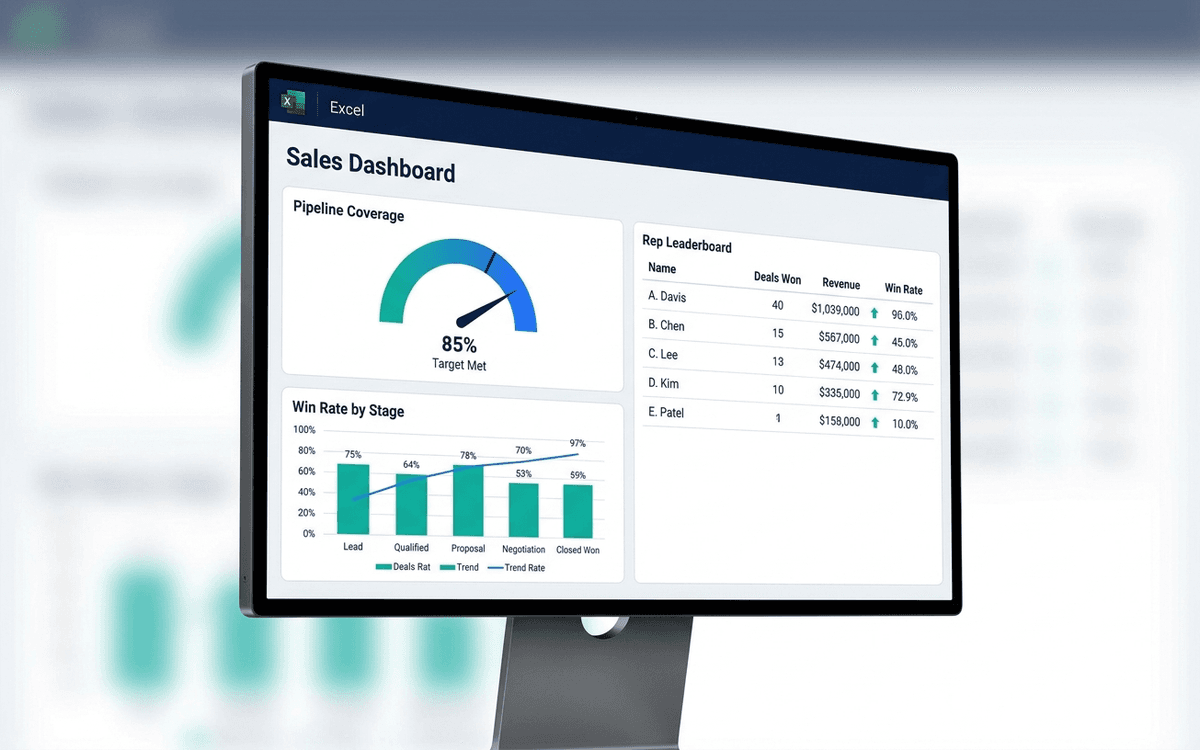
Sales Dashboard Template
A sales dashboard template covering what sales leaders actually run the team against — pipeline coverage, win rate by stage, sales cycle length, rep-level performance, and forecast accuracy — in a one-page weekly forecast call format.
When the template isn't enough
AppDeck's dashboards portal turns this template into a live workspace — version control, permissions, signatures, and analytics built in.