
Executive Dashboard: The Complete Guide for CEOs and CFOs
An executive dashboard is a single-pane view of the KPIs that matter to leadership. This guide covers KPI selection, design principles, real-time metrics, and how to choose the right executive dashboard software for your team.
In This Guide
What Is an Executive Dashboard?
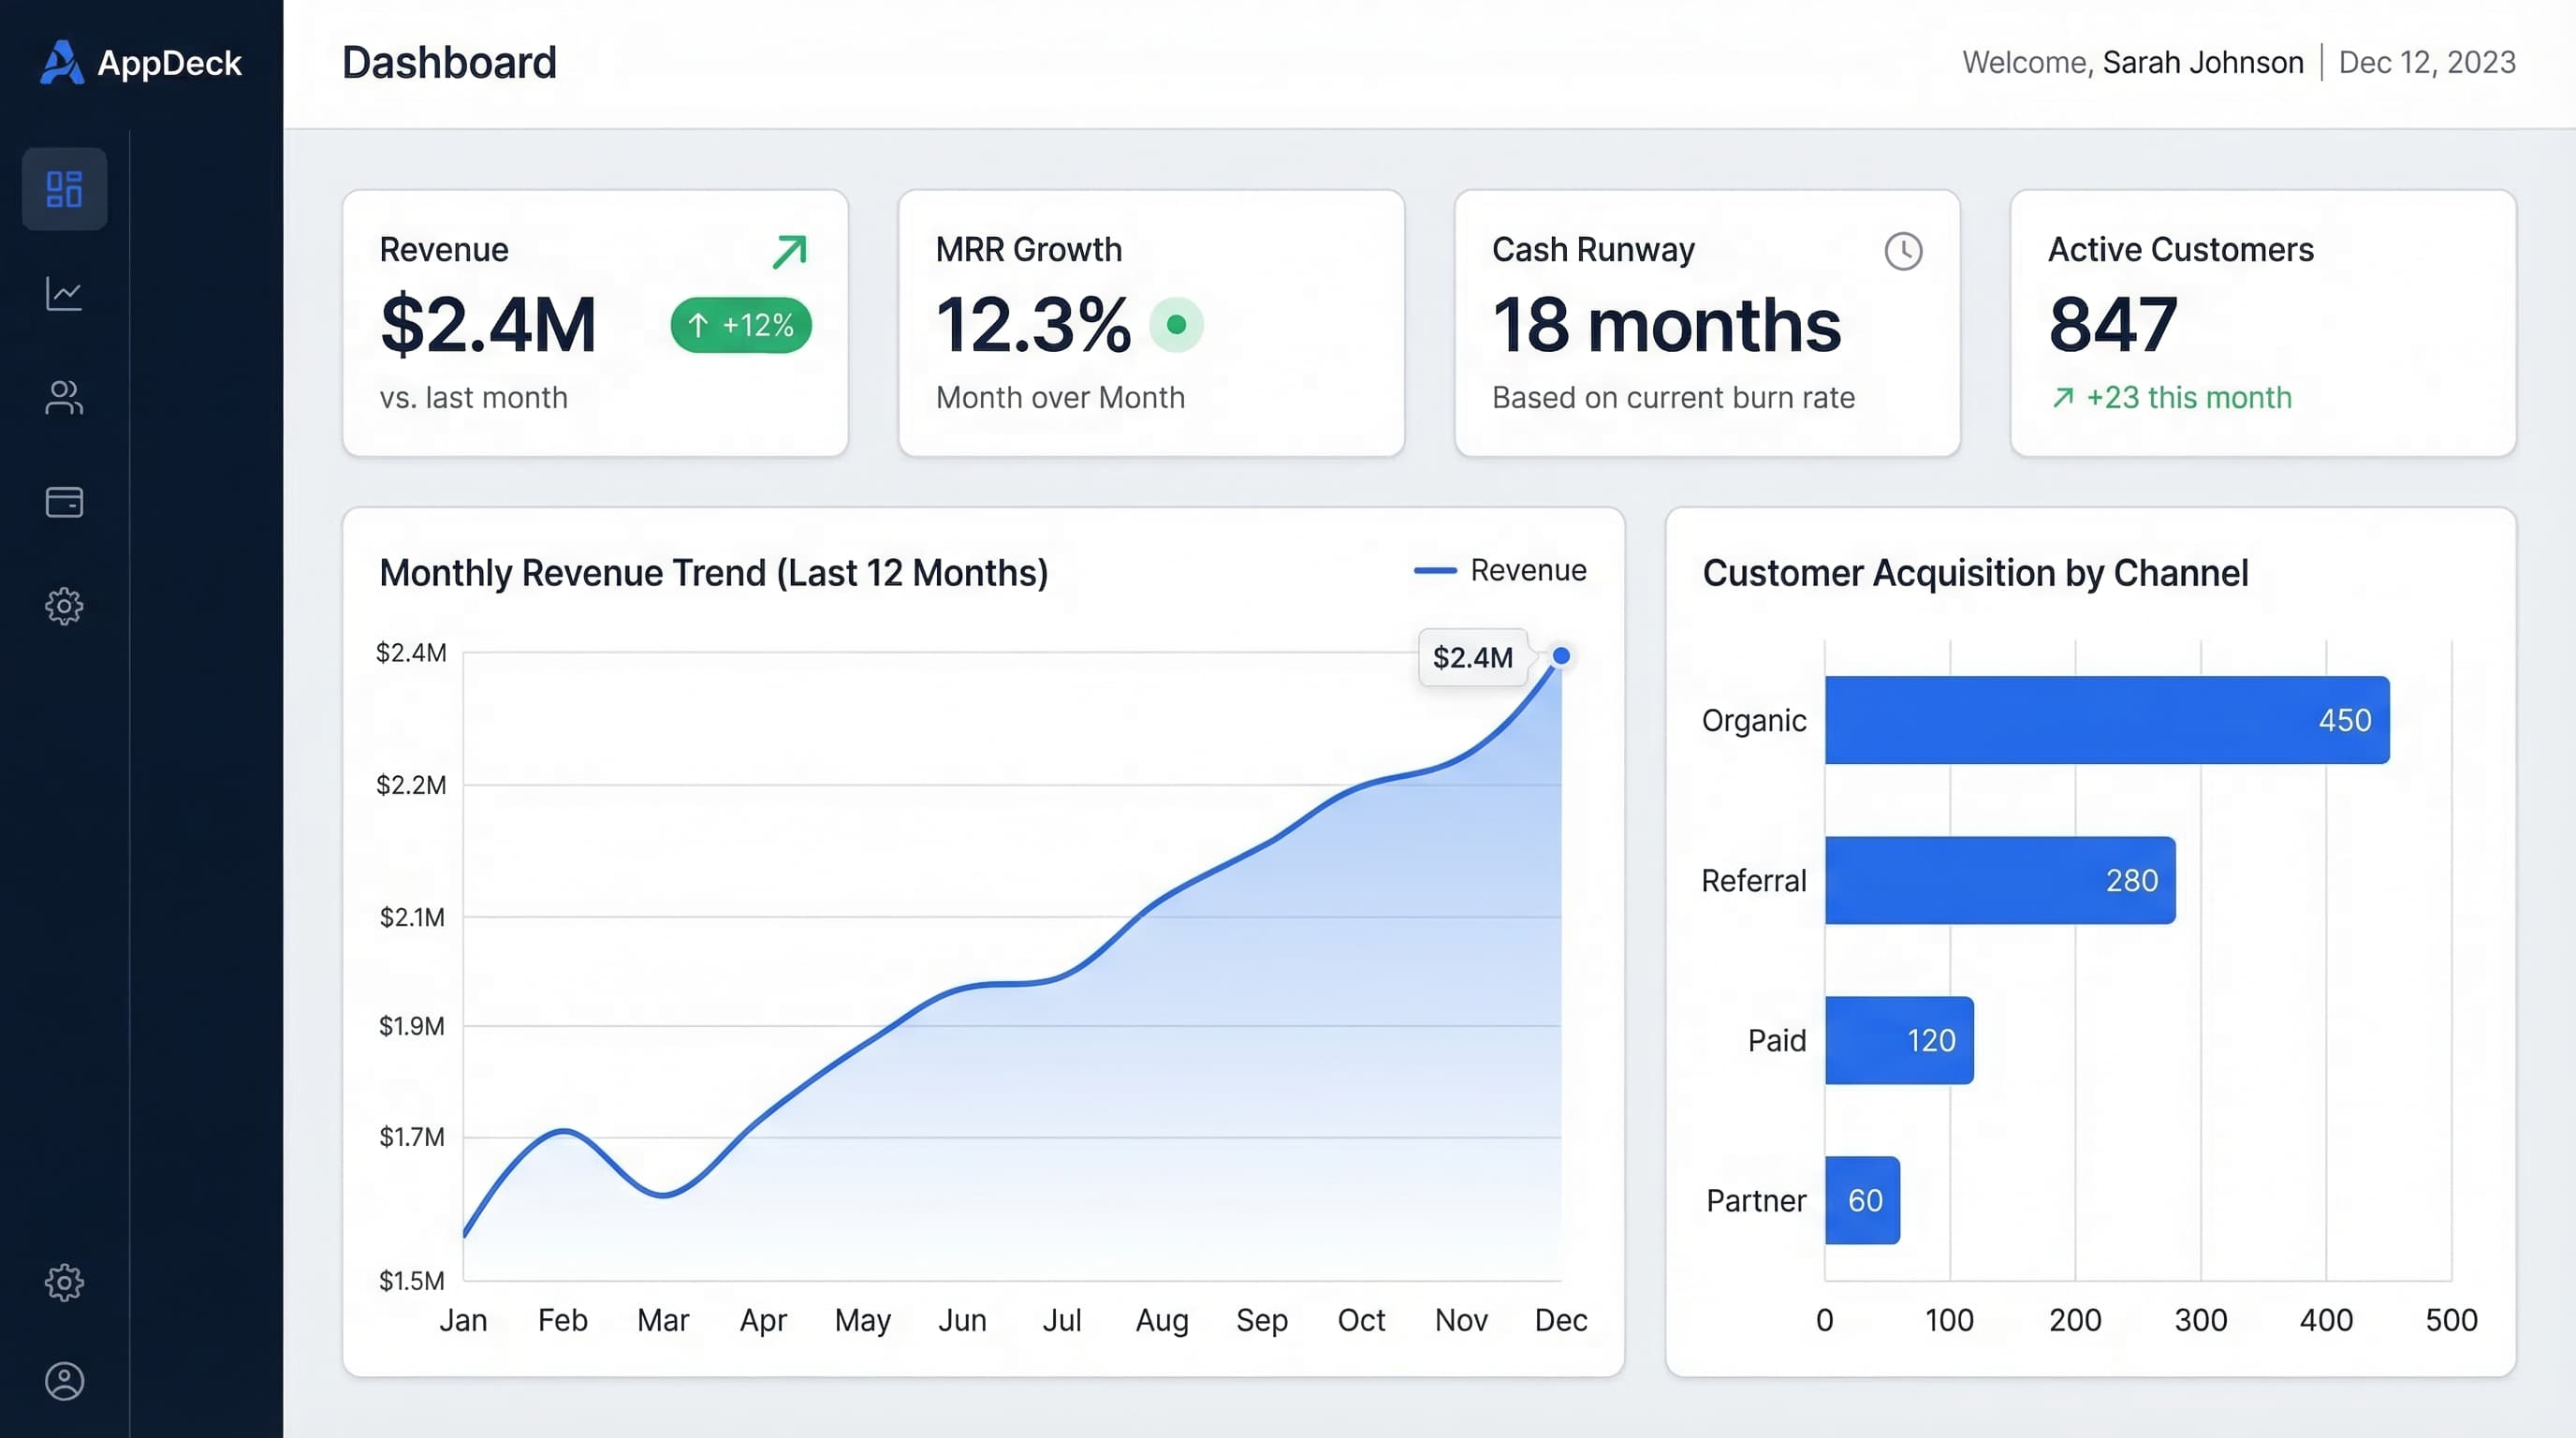
An executive dashboard is a visual reporting tool that consolidates your most important business metrics into a single view. Instead of digging through spreadsheets, email reports, or multiple software tools, executives open one screen and immediately see how the business is performing.
Unlike operational dashboards designed for day-to-day teams, executive dashboards are built for strategic decision-making. They surface high-level KPIs, trends, and exceptions that leaders need to steer the company.
Who Uses Executive Dashboards?
CEO
Company-wide health, growth trajectory, and strategic initiative progress
CFO
Financial health, cash flow, margins, burn rate, and budget variance
CRO
Pipeline, win rates, quota attainment, and revenue forecast
CMO
Acquisition costs, lead generation, brand metrics, and campaign ROI
Board
Governance metrics, fiduciary KPIs, and company performance vs. plan
The best executive dashboards are not just data displays. They tell a story about business performance and guide leaders toward the decisions that matter most.
Choosing the Right KPIs
The most common mistake in dashboard design is tracking too many metrics. The right KPIs depend on your role, industry, and current business priorities. Here is a framework to help you choose.
1. Start with your top strategic question
Every dashboard should answer one primary question. For a CEO: "Are we on track to hit our annual plan?" For a CFO: "Do we have the cash runway to reach profitability?"
2. Identify leading and lagging indicators
Lagging indicators (revenue, churn) tell you what happened. Leading indicators (pipeline, NPS, trial signups) predict what will happen next. Include both.
3. Limit to 5-7 KPIs per view
People can only hold 5-7 items in working memory. If your dashboard has 20 metrics, nothing stands out. Focus ruthlessly on the vital few.
4. Make every KPI actionable
If a metric drops, can someone take action? If not, it is a vanity metric. Every KPI should have a clear owner and response plan.
Deep Dive: CFO Metrics
Need a detailed breakdown of financial KPIs for your executive dashboard? Our guide covers gross margin, burn rate, ARR, and 15+ more essential CFO metrics.
Read: Essential CFO Dashboard Metrics→Dashboard Design Best Practices
A well-designed dashboard reduces cognitive load and helps executives make faster decisions. Follow these five principles to create dashboards that people actually use.
Answer one question per dashboard
Resist the urge to cram everything into one screen. A CEO dashboard answers "How is the business performing overall?" A sales dashboard answers "Will we hit quota this quarter?" Separate concerns into separate views.
Limit to 5-7 KPIs per view
More is not better. Every additional metric competes for attention. If stakeholders want more detail, link to drill-down views rather than crowding the main dashboard.
Always provide context
A number without context is meaningless. Show comparisons: vs. last period, vs. target, vs. budget. Use trend lines, sparklines, and color-coded indicators so executives instantly know if a metric is on track.
Make it actionable
Every metric should prompt a decision or action. Include annotations explaining why a number changed, and link to the next step — pipeline report, customer health dashboard, etc.
Match the refresh frequency to the audience
Board members need monthly or quarterly snapshots. A CEO might check daily. A CRO needs near real-time pipeline data. Design the cadence around how often each audience checks the dashboard.
Dashboard Examples by Role
The best way to learn dashboard design is to study real examples. We have compiled detailed guides with screenshots, KPI breakdowns, and templates for every executive role.
20 KPI Dashboard Examples
Real-world dashboard examples across CEO, CFO, sales, marketing, and operations roles with annotated screenshots.
View examples →Executive Dashboard Templates
Ready-to-use templates for CEO, CFO, and CRO dashboards. Copy the layout and customize with your own data.
Get templates →Sales Dashboard Examples for CROs
Pipeline, forecast, quota attainment, and deal velocity dashboards designed for revenue leaders.
View sales dashboards →Essential CFO Dashboard Metrics
The 18 financial KPIs every CFO dashboard needs, from gross margin and burn rate to ARR and cash runway.
See CFO metrics →Data Sources & Integrations
An executive dashboard is only as good as the data behind it. The best dashboards pull live data from the tools your teams already use, eliminating manual data entry and ensuring metrics are always current.
Salesforce
CRM & Sales
HubSpot
CRM & Marketing
QuickBooks
Accounting
Xero
Accounting
Stripe
Payments
Google Analytics
Web Analytics
Jira
Project Management
Slack
Communication
PostgreSQL
Database
When evaluating dashboard software, check that it supports native integrations with your core systems. Native integrations update automatically, require no engineering effort to maintain, and handle API changes behind the scenes.
See all AppDeck integrations→Board Reporting with Dashboards
Board meetings are high-stakes moments where data clarity matters most. Instead of assembling static slide decks from outdated spreadsheets, leading companies give their board members access to live dashboards that update in real time.
Before: Static Reports
- xData is 2-3 weeks old by meeting day
- xHours spent manually building board decks
- xDirectors ask questions you cannot answer live
- xNo visibility between quarterly meetings
After: Live Dashboards
- Real-time data during the meeting
- Dashboards auto-generate from live data
- Drill into any metric on the spot
- Directors check KPIs anytime via portal
Choosing Executive Dashboard Software
There are dozens of tools on the market, from general-purpose BI platforms to purpose-built executive dashboard software. The best leadership dashboards share a handful of traits — here is what to look for when evaluating your options. For hands-on help, see our executive dashboard software comparison and dashboard design best practices.
Ease of setup
Drag-and-drop builders and pre-built templates that let you go live in hours, not weeks.
Native integrations
Direct connections to your CRM, accounting software, and payment processor without custom API work.
Role-based access
Control who sees what. Board members, investors, and executives need different data access levels.
Mobile experience
First-class phone and tablet experience, not an afterthought. Executives check KPIs on the go.
Security & compliance
SOC 2 certification, encryption, SSO, and audit logging for your most sensitive data.
Sharing & collaboration
Share dashboards through secure portals with board members, investors, or clients.
AppDeck Executive Dashboard
AppDeck is purpose-built for executive dashboards with native integrations, role-based access, and a secure portal for sharing with board members and investors. Set up your first dashboard in under 30 minutes.
Explore AppDeck Executive Dashboard→Related Guides
Go deeper with our in-depth guides
Ready to Build Your Executive Dashboard?
Connect your tools and create a live executive dashboard in minutes. No engineering required.
Free 14-day trial - now in beta - Setup in minutes