
CFO Executive Dashboard: Essential Metrics & Complete Setup Guide (2026)
Complete guide to building a CFO executive dashboard. Essential financial KPIs, board reporting metrics, real-time analytics, dashboard design best practices, and software recommendations.
TL;DR: Complete guide to building a CFO executive dashboard. Essential financial KPIs, board reporting metrics, real-time analytics, dashboard design best practices, and software recommendations.
Introduction
A great CFO dashboard answers your board's most critical questions in 3 seconds: Are we financially healthy? Do we have enough runway? Are we hitting targets? Are unit economics improving?
After building executive dashboards for 15+ CFOs across public companies, late-stage startups, and mid-market firms, I've learned what separates dashboards that drive decisions from those that gather dust: ruthless focus on the metrics that actually matter.
In this comprehensive guide, you'll learn exactly which financial metrics to track, how to design a board-ready CFO dashboard, and how to implement real-time analytics that transform your board meetings from data dumps into strategic discussions.
Why CFOs Need Executive Dashboards
The Static PDF Problem
Before implementing real-time dashboards, most CFOs struggle with:
- ❌ Spending 10-20 hours updating PowerPoint slides before each board meeting
- ❌ Board asking "what's changed since you sent the packet?" (data already outdated)
- ❌ Directors unable to check metrics between meetings
- ❌ Last-minute scrambles when numbers change 24 hours before meeting
- ❌ No visibility into trends—just point-in-time snapshots
- ❌ Board members asking basic questions that could be self-served
The Real-Time Dashboard Solution
Modern CFO dashboards deliver:
- ✅ Real-time financial data connected to your accounting system
- ✅ Directors can check metrics anytime (not just quarterly)
- ✅ Automatic updates—no manual PowerPoint refreshes
- ✅ Historical trends visible at a glance
- ✅ Board meetings focus on strategy, not data explanation
- ✅ 60% reduction in board prep time
Result: CFOs save 8-12 hours per board meeting cycle while directors arrive better prepared and more engaged.
Essential CFO Dashboard Metrics (The Core 15)
Your CFO dashboard should answer these questions instantly. Here are the metrics that matter most:
1. Revenue Metrics (Top Priority)
Monthly Recurring Revenue (MRR) / Annual Recurring Revenue (ARR)
What it shows: Predictable revenue base (for SaaS/subscription businesses)
How to display:
MRR: $450K (+12% MoM) ✅
ARR: $5.4M (on track for $6.5M EOY target) ✅

Breakdown:
New MRR: +$68K
Expansion MRR: +$14K
Churn MRR: -$14K
Net New MRR: +$54K
Why it matters: MRR is the single most important metric for subscription businesses. Board wants to see growth trajectory and components (new vs expansion vs churn).
Revenue vs Target
What it shows: Performance against plan
How to display:
Q4 Revenue: $1.28M / $1.5M target (85%) ⚠️
YTD Revenue: $4.2M / $5.0M target (84%)

30 days remaining in quarter
Gap to close: $220K
Why it matters: Board needs to know if you're hitting plan. If not, what's the gap and plan to close it?
2. Profitability Metrics
Gross Margin
What it shows: Profitability after direct costs
How to display:
Gross Margin: 78% ✅
Target: 75%+
Trend: Improved from 74% last quarter

Breakdown:
Revenue: $450K
COGS: $99K
Gross Profit: $351K
Why it matters: Shows unit economics health and scalability potential.
EBITDA / Operating Margin
What it shows: Operational profitability
How to display:
EBITDA: -$180K (-40% margin)
Target: Path to profitability Q2 2026

Burn Reduction:
Q1: -$240K (-55%)
Q2: -$210K (-48%)
Q3: -$180K (-40%) ✅ improving
Q4 Target: -$150K (-32%)
Why it matters: Board wants to see path to profitability, not just current losses.
3. Cash & Liquidity (Mission Critical)
Cash Position & Runway
What it shows: Financial survival timeline
How to display:
Cash Balance: $1.65M ✅
Monthly Burn: $201K
Runway: 8.2 months ⚠️

Projections:
Current trajectory: Aug 2025
Best case (+20% revenue): Oct 2025
Worst case (-10% revenue): Jun 2025

Next Milestone: $6M ARR (4 months)
Capital Needed: $3M Series B (Q2 2025)
Why it matters: Most important metric for early-stage companies. Board must know: when do we run out of money?
Burn Multiple
What it shows: Capital efficiency
How to display:
Burn Multiple: 2.1 ⚠️
Target: Under 2.0

Formula: Net Burn / Net New ARR
Calculation: $201K burn / $96K net new ARR = 2.1

Benchmark:
Excellent: Under 1.5
Good: 1.5-2.0
Needs improvement: 2.0-3.0 ⬅️ You are here
Poor: Over 3.0
Why it matters: Shows how efficiently you're converting cash into growth.
4. Growth Metrics
Revenue Growth Rate
What it shows: Growth velocity
How to display:
MoM Growth: +12% ✅
QoQ Growth: +38%
YoY Growth: +215%

Growth trajectory:
Jan: +8%
Feb: +9%
Mar: +11%
Apr: +12% ⬆️ accelerating
Why it matters: Board wants to see acceleration or deceleration trends.
Net Revenue Retention (NRR)
What it shows: Revenue retention + expansion from existing customers
How to display:
Net Revenue Retention: 112% ✅
Target: Greater than 100%

Breakdown:
Starting cohort ARR: $1.0M
Churn: -$30K (-3%)
Expansion: +$150K (+15%)
Ending ARR: $1.12M

NRR = 112%
Why it matters: NRR over 100% means you grow without new customers. Critical for SaaS.
5. Unit Economics
Customer Acquisition Cost (CAC)
What it shows: Cost to acquire a customer
How to display:
Blended CAC: $4,200 ✅
Paid CAC: $6,800
Organic CAC: $1,200

Calculation:
Sales & Marketing Spend: $142K
New Customers: 34
CAC: $4,176

Trend: Down from $4,800 last quarter ✅
Lifetime Value (LTV)
What it shows: Total revenue from a customer
How to display:
LTV: $18,900 ✅

Calculation:
ARPU: $525/month
Gross Margin: 78%
Churn Rate: 3.2%/month
LTV = ($525 × 0.78) / 0.032 = $18,900
LTV:CAC Ratio
What it shows: Return on acquisition investment
How to display:
LTV:CAC Ratio: 4.5:1 ✅

$18,900 LTV / $4,200 CAC = 4.5

Benchmark:
Excellent: 5:1 or higher
Good: 3:1 to 5:1 ⬅️ You are here
Acceptable: 2:1 to 3:1
Poor: Under 2:1
Why it matters: Shows if customer acquisition economics are sustainable.
CAC Payback Period
What it shows: Time to recover acquisition cost
How to display:
CAC Payback: 14 months ⚠️
Target: Under 12 months

Calculation:
CAC: $4,200
Monthly Gross Profit per Customer: $409
Payback = $4,200 / $409 = 10.3 months
(Adjusted for S&M timing: ~14 months)
6. Customer Metrics
Customer Count & Growth
What it shows: Customer base expansion
How to display:
Total Customers: 187 (+28% YoY) ✅
New Customers (this month): 34
Churned Customers: 6
Net Growth: +28 customers

Customer Segmentation:
Enterprise (>$50K ARR): 12 customers (42% of revenue)
Mid-Market ($10K-50K): 58 customers (38%)
SMB (under $10K): 117 customers (20%)
Gross & Net Churn
What it shows: Customer and revenue retention
How to display:
Logo Churn: 3.2% monthly ✅
Target: Under 5%

Revenue Churn (gross): 4.1% ✅
Revenue Churn (net): -12% ✅ (negative = expansion)

Churn by Cohort:
Months 1-3: 8% (onboarding issues)
Months 4-12: 4%
Months 13+: 2% (sticky customers)
7. Operational Efficiency
Operating Expenses vs Budget
What it shows: Spending discipline
How to display:
Monthly OpEx: $651K
Budget: $665K
Variance: -$14K (2% under) ✅

Breakdown:
R&D: $245K (95% of budget) ✅
Sales & Marketing: $268K (102%) ⚠️
G&A: $138K (92%) ✅
Headcount & Burn
What it shows: Team growth vs burn rate
How to display:
Headcount: 47 (target: 50 by Q4) ✅
Open Roles: 3

Burn per Employee: $4,277/month
Industry Benchmark: $3,500-5,000

Revenue per Employee: $115K ARR
Target: $150K+ (SaaS benchmark)
8. Key SaaS Metrics (if applicable)
Magic Number
What it shows: Sales efficiency
How to display:
Magic Number: 0.85 ✅
Target: 0.75+

Formula: Net New ARR / S&M Spend
Calculation: ($96K × 4) / $450K = 0.85

Interpretation:
Over 1.0: Excellent, scale quickly
0.75-1.0: Good, scale sensibly ⬅️ You are here
Under 0.75: Improve efficiency before scaling
Rule of 40
What it shows: Balance of growth and profitability
How to display:
Rule of 40: 42% ✅
Target: 40%+

Calculation:
YoY Growth Rate: +82%
EBITDA Margin: -40%
Rule of 40 = 82% + (-40%) = 42%

Healthy SaaS companies score 40%+
CFO Dashboard Design Best Practices
1. Information Hierarchy: Most Important Metrics First
Top Section (Always Visible):
- Cash position & runway
- Revenue vs target
- MRR/ARR growth
- Burn rate
Middle Section (One Scroll):
- Unit economics (CAC, LTV, payback)
- Customer metrics (count, churn, NRR)
- Profitability (gross margin, EBITDA)
Bottom Section (Detailed):
- Operational details
- Budget vs actuals
- Cohort analysis
- Scenario planning
2. Use Context, Not Just Numbers
Bad:
Revenue: $1.2M
Good:
Revenue: $1.2M (107% of $1.12M target) ✅
Trend: +15% MoM ↗️
Why it matters: Context (target, trend, status) makes data actionable.
3. Visual Status Indicators
Use color coding consistently:
- ✅ Green: On track, exceeding target
- ⚠️ Yellow: Needs attention, slightly below target
- 🚨 Red: Critical issue, significantly below target
Example:
Runway: 8.2 months ⚠️ (target: 12+ months)
Churn: 3.2% ✅ (target: under 5%)
CAC Payback: 14 months 🚨 (target: under 12)
4. Show Trends, Not Just Current State
Include sparklines or mini charts:
MRR: $450K (+12% MoM) ✅
Trend: ▁▂▃▅▇ (accelerating)

Last 6 months:
Oct: $358K
Nov: $387K
Dec: $412K
Jan: $428K
Feb: $441K
Mar: $450K
5. Benchmark Against Targets & Industry
Always include:
- Your target or goal
- Industry benchmark (if relevant)
- Your position relative to both
Example:
Gross Margin: 78%
Your Target: 75%+ ✅
Industry Benchmark (SaaS): 70-80% ✅
Real-Time vs Static Dashboards
Static Dashboard Problems
Traditional approach:
- Export data from accounting system
- Import to Excel/Google Sheets
- Build charts and tables
- Export to PowerPoint
- Send PDF to board
- Data outdated by the time board reviews it
Time required: 10-20 hours per board meeting
Real-Time Dashboard Benefits
Modern approach:
- Connect dashboard to your data sources (QuickBooks, Stripe, Salesforce)
- Metrics update automatically (daily or real-time)
- Board accesses live dashboard anytime
- No manual updates required
Time required: Initial setup (2-4 hours), then automatic
Impact:
- Directors can check metrics between meetings
- No "what's changed since the board packet?" questions
- Board meetings focus on strategy, not data review
- CFO saves 8-12 hours per board cycle
How to Build Your CFO Dashboard
Step 1: Choose Your Core Metrics (10-15 Max)
Don't try to track everything. Focus on:
- 3-4 revenue metrics
- 2-3 profitability metrics
- 2-3 cash/liquidity metrics
- 2-3 growth metrics
- 2-3 unit economics metrics
Total: 12-16 metrics maximum
Step 2: Define Targets for Each Metric
For every metric, document:
- Current value
- Target value
- Why this target (benchmark, plan, board expectation)
- Status (on track, needs attention, critical)
Example:
| Metric | Current | Target | Status | Why This Target |
|---|---|---|---|---|
| MRR | $450K | $425K | ✅ On track | Board-approved FY plan |
| Runway | 8.2 mo | 12+ mo | ⚠️ Attention | Best practice: 12-18 mo |
| CAC Payback | 14 mo | 12 mo | 🚨 Critical | Industry benchmark |
Step 3: Connect Data Sources
Essential integrations:
- Accounting: QuickBooks, Xero, NetSuite (for financial data)
- Revenue: Stripe, Chargebee, Zuora (for subscription metrics)
- CRM: Salesforce, HubSpot (for customer data)
- HR: BambooHR, Gusto (for headcount)
Most modern dashboard tools connect via API.
Step 4: Design the Dashboard Layout
Recommended structure:
Section 1: Executive Summary
- Company health snapshot
- Top 3-5 metrics
- Critical issues requiring attention
Section 2: Revenue & Growth
- MRR/ARR
- Revenue vs target
- Growth rates
- Customer counts
Section 3: Profitability
- Gross margin
- EBITDA
- Operating expenses
Section 4: Cash & Liquidity
- Cash balance
- Burn rate
- Runway projections
Section 5: Unit Economics
- CAC, LTV, payback
- Customer retention
Section 6: Key Ratios
- Rule of 40
- Magic Number
- Burn multiple
Step 5: Establish Update Cadence
Real-time (automatic):
- Cash balance
- Revenue metrics
- Customer counts
Daily:
- Pipeline metrics
- Burn rate
Weekly:
- Operational KPIs
- Budget vs actuals
Monthly:
- Cohort analysis
- Detailed financial reports
- Board-ready summaries
CFO Dashboard Software Options
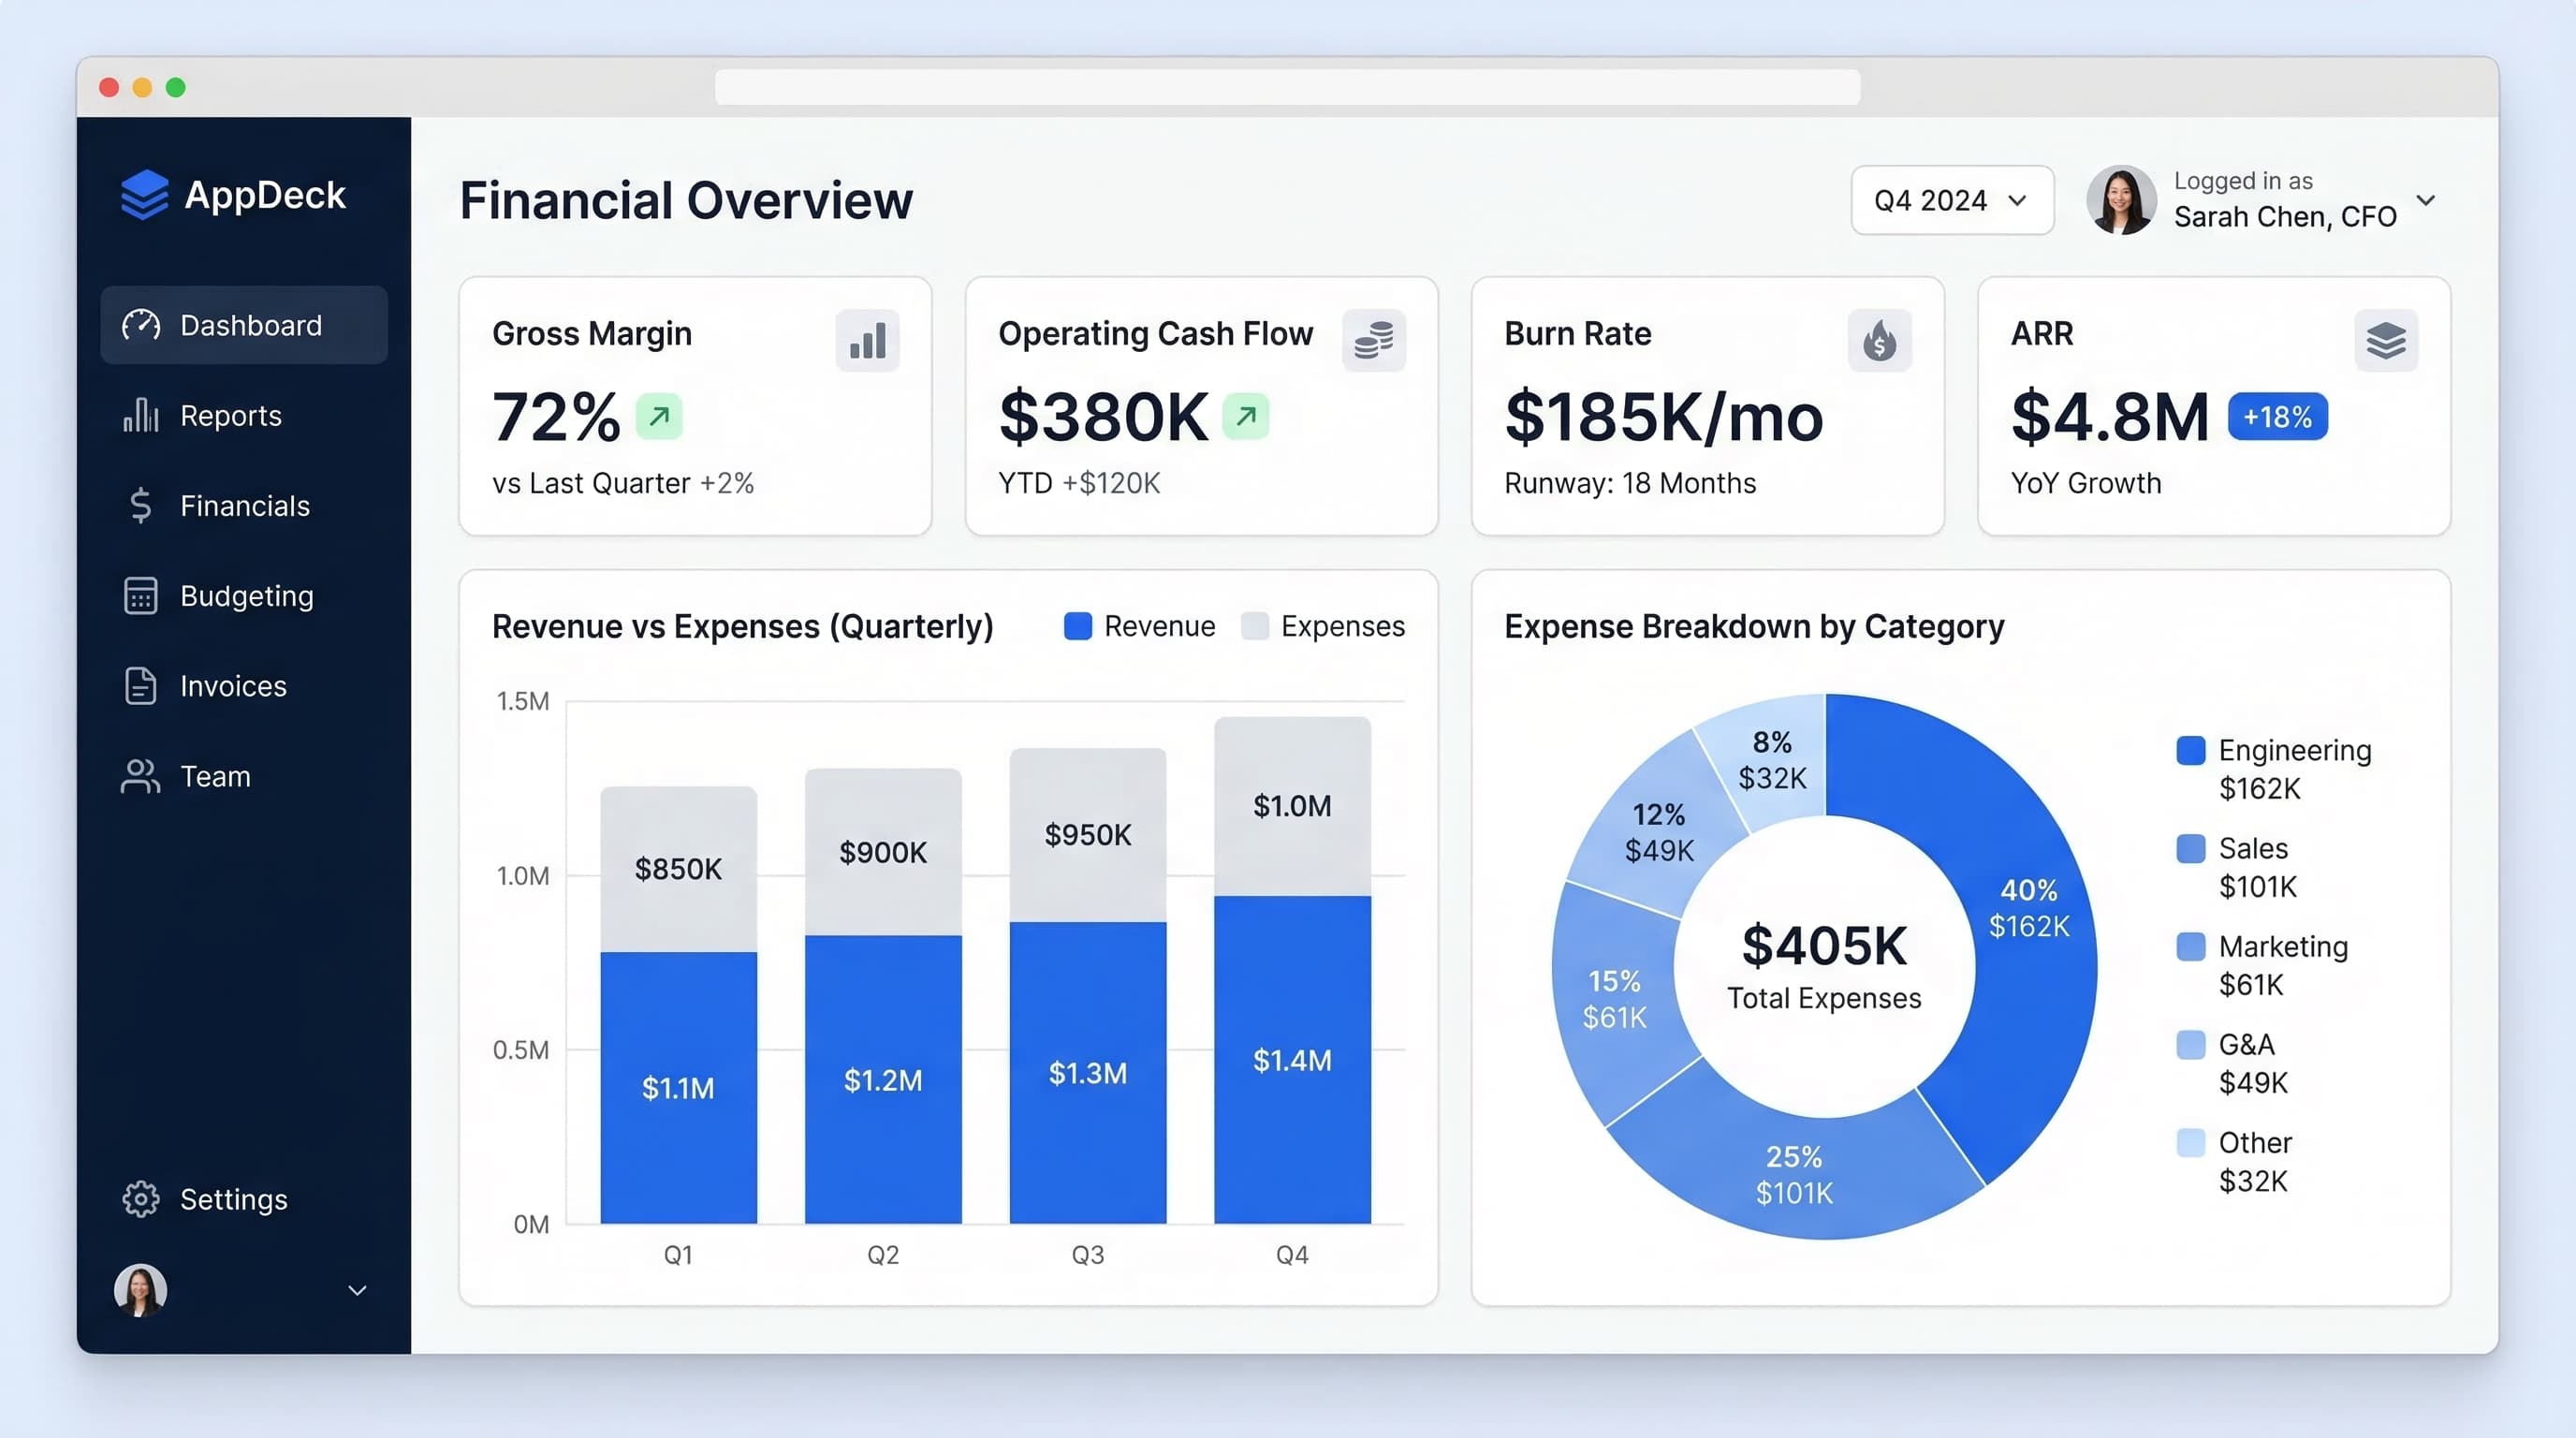
Option 1: AppDeck Executive Dashboard (Recommended)
Best for: CFOs wanting real-time dashboards integrated with board portals
Pricing: $299/month
Key features:
- ✅ Pre-built CFO dashboard templates
- ✅ Connects to QuickBooks, Stripe, Salesforce
- ✅ Real-time updates (no manual refresh)
- ✅ Share secure link with board
- ✅ Includes board portal for governance
- ✅ Mobile access
Why we recommend it:
- Purpose-built for board reporting (not just BI)
- Fast setup (30 minutes vs weeks)
- Combines financial dashboards + board portal
- Affordable vs traditional BI tools
Option 2: Traditional BI Tools (Tableau, Looker, Mode)
Best for: Large companies with data teams
Pricing: $10,000-$50,000+/year
Pros:
- Extremely powerful and customizable
- Enterprise-grade features
Cons:
- Requires data team to build/maintain
- Expensive (overkill for most companies under $50M revenue)
- Implementation takes months
- Steep learning curve
Option 3: Spreadsheets (Google Sheets, Excel)
Best for: Very early stage or testing concepts
Pricing: Free
Pros:
- Flexible
- Everyone knows how to use
- Good for prototyping
Cons:
- Manual updates required (10+ hours per board meeting)
- No real-time data
- Breaks easily as complexity grows
- Version control nightmares
Common CFO Dashboard Mistakes
Mistake #1: Too Many Metrics
Problem: 50 metrics on one dashboard
Result: Analysis paralysis, can't find what matters
Solution: Limit to 10-15 core metrics. Create separate detailed views for deep dives.
Mistake #2: No Context
Bad:
Revenue: $1.2M
Good:
Revenue: $1.2M (107% of target, +15% MoM) ✅
Solution: Always include target, trend, and status.
Mistake #3: Static Data
Problem: Dashboard shows data from 2 weeks ago
Result: Board asks "what's changed?" and CFO scrambles
Solution: Connect to live data sources for automatic updates.
Mistake #4: Inconsistent Metrics
Problem: Definitions change quarter to quarter
Result: Board can't track trends, questions credibility
Solution: Document metric definitions. Stick to them. If you change a formula, clearly communicate why.
Mistake #5: No Action Items
Problem: Dashboard shows problems but no planned actions
Result: Board loses confidence in management
Solution: For every red/yellow metric, include "Action Plan" with owner and timeline.
Board Meeting Dashboard Presentation Tips
1. Lead with the Summary
Start every board meeting with: "Here are the 3 most important things you need to know..."
- Financial health (cash, runway, revenue vs target)
- What's going well (green metrics, wins)
- What needs attention (red/yellow metrics, action plans)
2. Pre-Send Dashboard Link
Best practice:
- Send dashboard link 7 days before meeting
- Directors review on their own time
- Board meeting focuses on strategy, not data review
Result: 30% shorter meetings, 2x more strategic discussion
3. Be Ready for Deep Dives
Board will ask:
- "Why did churn increase?"
- "What's driving CAC up?"
- "How are you improving burn multiple?"
Have drill-down views ready showing:
- Churn by customer segment
- CAC by channel
- Burn reduction initiatives and timeline
4. Show Trends, Not Just Snapshots
Instead of: "Q3 revenue was $1.2M"
Say: "Revenue has grown 15% per quarter for 3 straight quarters. Based on pipeline, Q4 should be $1.35M."
5. Connect Metrics to Strategic Decisions
Link dashboard data to board decisions:
"Our CAC payback is 14 months (target: 12). We're launching two initiatives to reduce it:
- Improve onboarding (reduce time-to-value by 30%)
- Shift budget to organic channels (CAC $1,200 vs $6,800 paid)
We expect to hit 12-month payback by Q2. Should we accelerate investment in organic?"
This turns dashboards into decision-making tools, not just reporting.
Frequently Asked Questions
What is a CFO executive dashboard?
A CFO executive dashboard is a real-time view of the financial metrics that determine company health: cash position and runway, revenue versus target, MRR or ARR growth, gross margin, EBITDA, burn multiple, and unit economics like CAC, LTV, and payback. It replaces static PowerPoint board packets with live data pulled from accounting, billing, and CRM systems. A good CFO dashboard answers the board's most important questions—Are we healthy? Do we have enough cash? Are we hitting plan?—in 3 seconds rather than 30 slides.
How is a CFO dashboard different from a general BI tool like Tableau or Looker?
A CFO dashboard is purpose-built for board reporting and executive decisions, while general BI tools are open-ended analytics environments. Tableau and Looker are extremely powerful but require a data team to build and maintain, cost $10,000-$50,000+ per year, and take months to deploy. CFO dashboards ship with pre-built templates for the 10-15 metrics that matter, connect to QuickBooks, Stripe, and Salesforce out of the box, and surface board-ready views in 30 minutes. BI tools are right for large enterprises with data teams; CFO dashboards are right for companies under $50M revenue.
How many metrics should a CFO dashboard include?
10 to 15 core metrics is the right range. Most CFOs make the mistake of tracking 50 metrics, which produces analysis paralysis and obscures what actually matters. Concentrate on three or four revenue metrics, two or three profitability metrics, two or three cash and liquidity metrics, two or three growth metrics, and two or three unit economics metrics. Put detail views one click deep for cohort analysis, segment breakdowns, and budget variance. The executive summary at the top of the dashboard should display no more than five numbers.
Who should own and maintain the CFO dashboard?
The CFO owns the dashboard, but maintenance should be automated. With real-time integrations into accounting (QuickBooks, NetSuite), billing (Stripe, Chargebee), and CRM (Salesforce, HubSpot), the dashboard updates without manual work. The CFO defines the metrics, sets targets, and writes the narrative for board commentary. A finance or RevOps analyst handles data quality, definition changes, and reconciliation. Avoid the trap of designating one person to refresh PowerPoint slides each month—that defeats the purpose and ensures the dashboard is always stale by the time the board sees it.
When should a startup move from spreadsheet financial reporting to a dedicated dashboard?
Move off spreadsheets once you raise institutional capital or hit roughly $1M ARR. Below that, a Google Sheets model updated monthly is fine and the board is usually small enough to accept it. Once you have a venture board with quarterly meetings, three or more data sources to reconcile, or you're spending more than 10 hours per board cycle on manual updates, the spreadsheet is costing you more than the dashboard would. A real-time dashboard saves 8-12 hours per board meeting cycle and eliminates the "what's changed since the packet?" question that erodes credibility.
Conclusion
An effective CFO dashboard transforms board governance from reactive data review to proactive strategic planning.
Essential CFO metrics:
- Revenue (MRR/ARR, growth, vs target)
- Profitability (gross margin, EBITDA)
- Cash & liquidity (balance, burn, runway)
- Unit economics (CAC, LTV, payback)
- Growth (NRR, customer counts, churn)
Dashboard design principles:
- Focus on 10-15 core metrics (not 50)
- Always show context (target, trend, status)
- Use real-time data (not static PDFs)
- Visual hierarchy (most important metrics first)
- Benchmark against targets and industry
Implementation:
- Define your core metrics and targets
- Connect to data sources for real-time updates
- Design clear, focused dashboard layout
- Share with board 7 days before meetings
- Use meetings for strategy, not data review
Recommended tools:
- AppDeck Executive Dashboard for CFOs wanting integrated board portal + financial dashboards
- Traditional BI for large enterprises with data teams
- Spreadsheets only for very early stage prototyping
Next steps:
- Choose your 10-15 core CFO metrics
- Define targets for each metric
- Set up real-time dashboard (AppDeck recommended)
- Share with board before next meeting
- Iterate based on board feedback
Your CFO dashboard should answer the board's most important questions in 3 seconds. If it doesn't, simplify until it does.
Related Resources:
- The Complete Guide to Executive Dashboards
- Financial Dashboard Template: 8 Examples — P&L, cash flow, budgets, and board reporting
- Executive Dashboard Software: 8 Platforms Compared
- Board Reporting Software: 7 Tools CFOs Actually Use
- Board Portal Software Comparison 2026
- Executive Dashboard Templates
- AppDeck Executive Dashboard
- CFO Solutions

Founder & CEO, AppDeck
Serial entrepreneur with 20+ years building B2B software companies. Former executive managing 2,800+ employees across three continents. Vik reviews all AppDeck content for accuracy and practical relevance.
Share this article
Explore Related Solutions
Related Articles
Financial Dashboard Template: 8 Examples for CFOs, Controllers & FP&A
Free financial dashboard templates for P&L, cash flow, budget vs. actuals, revenue forecasting, and board reporting. Layouts, key metrics, and formulas for finance teams.
Board Reporting Software: 7 Tools CFOs Actually Use in 2026
Comprehensive comparison of board reporting software for CFOs. Compare features, pricing, and real user experiences with Diligent, BoardEffect, AppDeck, and more.
Board Report Template: 6 Free Templates for Effective Board Reporting
Download free board report templates for CEOs, CFOs, and committee chairs. Financial reports, operational updates, and strategic review formats.