
Executive Dashboard Software: 8 Best Platforms Compared (2026)
Compare the best executive dashboard software for 2026. Features, pricing, and honest reviews of Tableau, Power BI, Looker, AppDeck, Geckoboard, Klipfolio, Databox, and Domo.
TL;DR: Compare the best executive dashboard software for 2026. Features, pricing, and honest reviews of Tableau, Power BI, Looker, AppDeck, Geckoboard, Klipfolio, Databox, and Domo.
Introduction
Most executive dashboard projects fail. Not because the software is bad — because the wrong software was chosen for the audience.
I've watched this happen dozens of times: a company buys Tableau because it's the "gold standard," then discovers that their CEO won't log into a BI tool, their board members can't navigate the interface, and the data team spends 20 hours a week maintaining dashboards nobody reads.
The best executive dashboard software depends entirely on who's using it and how. A CFO who lives in data needs different capabilities than a board member who wants a 30-second snapshot once a quarter. A 10-person startup has different needs than a 500-person enterprise with a dedicated analytics team.
After 15+ years building and evaluating dashboards across every company stage, I've narrowed it down to 8 platforms that actually work for executive use cases. This guide covers what each one does best, where it falls short, and which type of organization it's right for.
What Is Executive Dashboard Software?
Executive dashboard software gives leaders real-time visibility into the metrics that matter most — revenue, cash flow, pipeline, customer health, and team performance — without digging through spreadsheets or waiting for reports.
Core capabilities:
- KPI tracking with targets and trend lines
- Data integration from multiple sources (CRM, accounting, HR, product)
- Role-based views (CEO sees everything, VP sees their function)
- Automated data refresh (daily, hourly, or real-time)
- Shareable links or secure portals for board members and investors
Who needs this:
- CEOs and founders tracking company health
- CFOs monitoring financial performance
- CROs managing pipeline and revenue
- Board members reviewing quarterly performance
- Investors receiving portfolio updates
Key Features to Compare
Before diving into specific platforms, here's what matters when choosing executive dashboard software:
1. Ease of Use (for the Executive, Not the Builder)
The #1 predictor of dashboard adoption is whether the end user — the executive — finds it intuitive. A dashboard an executive won't open is worthless regardless of how powerful it is.
What to look for: Can a non-technical CEO open the dashboard and understand the numbers in under 10 seconds? Can they drill down without training?
2. Data Integrations
Your dashboard is only as good as the data flowing into it. Most executives need data from 3-8 sources: CRM (Salesforce, HubSpot), accounting (QuickBooks, Xero), HR (BambooHR, Rippling), product analytics, and support tools.
What to look for: Native integrations vs. requiring a data warehouse or ETL pipeline. Native is faster to set up but less flexible. Warehouse-based is powerful but requires a data team.
3. Sharing and Access Control
Executive dashboards are often shared with people outside your organization — board members, investors, advisors. The sharing model matters.
What to look for: Can you share a secure link without requiring the recipient to create an account? Can you set different views for different audiences?
4. Update Frequency
Some decisions need real-time data. Others need weekly summaries. Over-engineering refresh frequency wastes money and creates noise.
What to look for: Does the platform support the update cadence you actually need? Real-time costs more and requires more robust integrations.
5. Customization vs. Templates
Some teams want pixel-perfect custom dashboards. Others want to pick a template and go. Neither approach is wrong — it depends on your resources.
What to look for: Does the platform match your team's technical capacity? If you don't have a data analyst, you need templates. If you do, you need flexibility.
8 Best Executive Dashboard Software Platforms
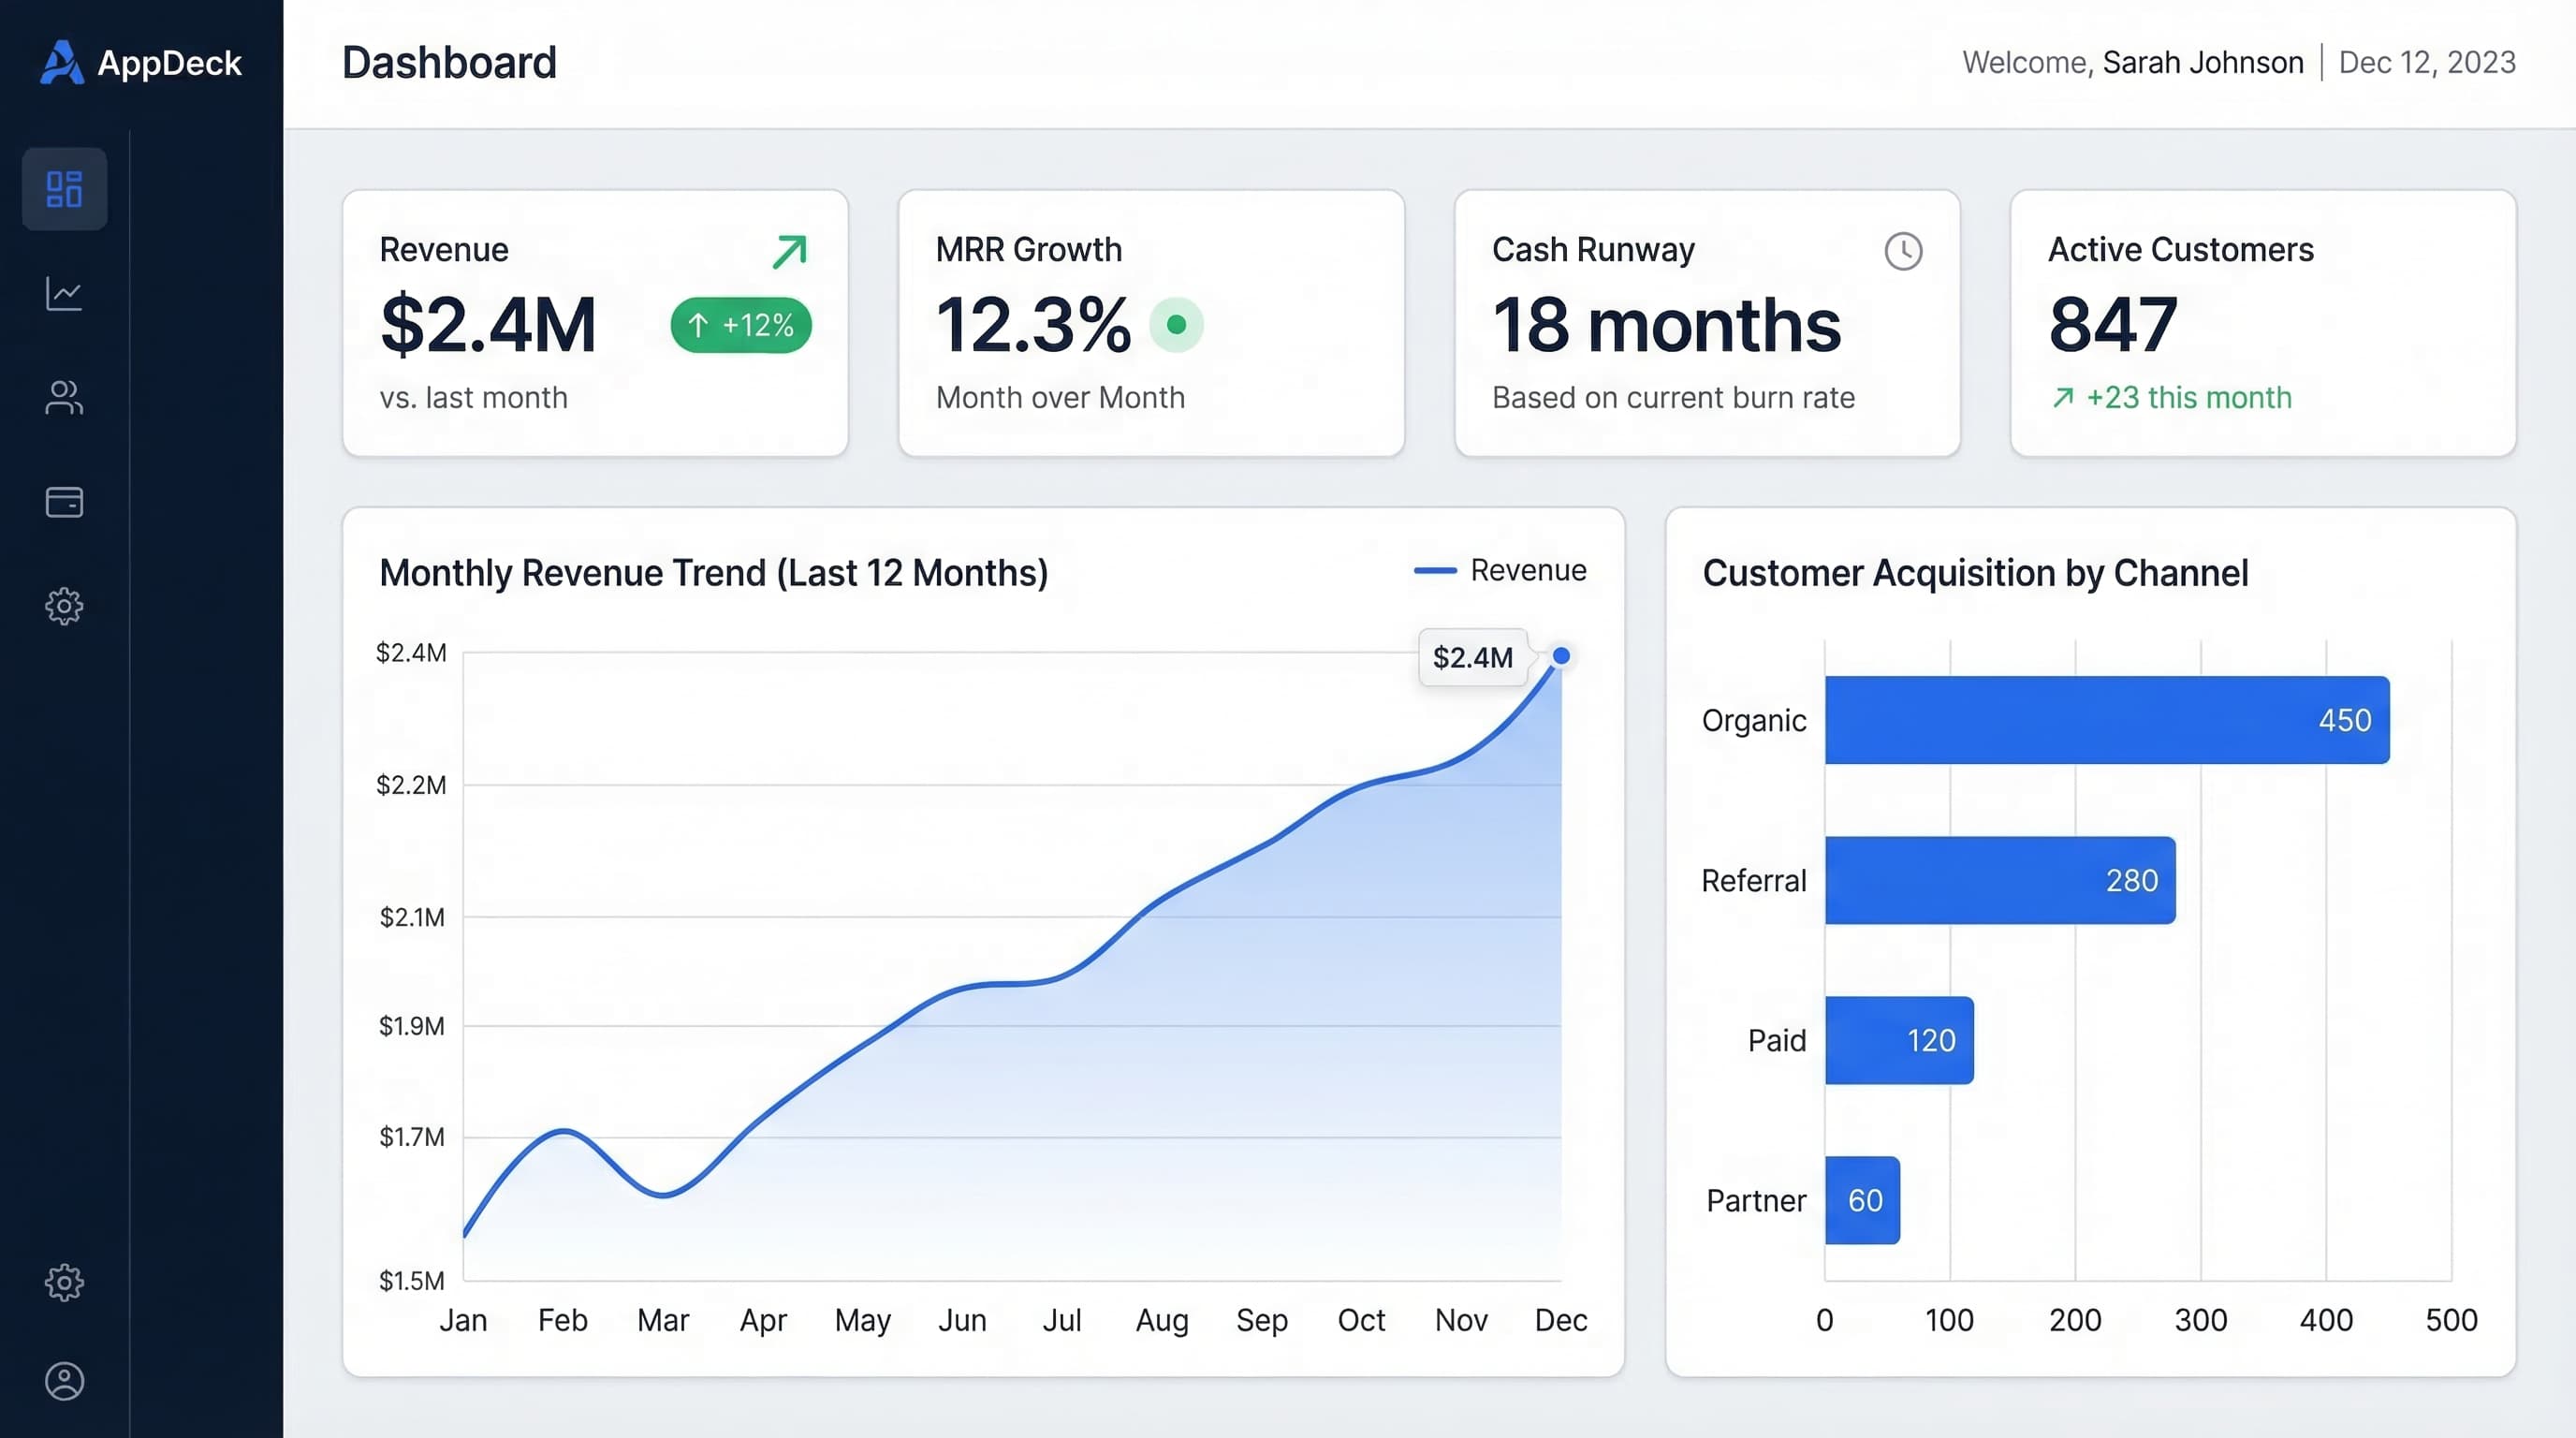
1. AppDeck
Best for: Teams that share dashboards with external stakeholders (board members, investors, clients)
AppDeck is a portal platform with built-in executive dashboards designed for sharing metrics with people outside your organization. Unlike traditional BI tools where everyone needs a license, AppDeck gives you a secure, branded portal where stakeholders log in and see exactly what you want them to see.
Key strengths:
- Purpose-built for external sharing — board members, investors, and clients get a branded portal, not a BI tool login
- Pre-built templates for CEO, CFO, CRO, and board dashboards
- Connects to common data sources (Salesforce, QuickBooks, HubSpot, Stripe)
- Role-based permissions — show different metrics to different audiences
- White-label branding — your logo, your domain, your colors
- No per-viewer licensing — share with unlimited stakeholders
Limitations:
- Not a full BI tool — designed for executive summaries, not ad-hoc data exploration
- Newer platform with smaller community than established BI tools
- Best suited for sharing dashboards, not building complex analytical models
Pricing: Starting at $99/month. No per-seat fees for viewers.
Best fit: Companies that need to share polished dashboards with board members, investors, or clients without giving everyone a BI tool license. Particularly strong for startups managing investor updates and mid-market companies with active boards.
Try AppDeck Executive Dashboard →
2. Tableau
Best for: Large enterprises with dedicated data teams who need deep analytical capabilities
Tableau is the most powerful visualization tool on the market. If you have a data team that can build and maintain dashboards, Tableau can create almost anything you can imagine.
Key strengths:
- Unmatched visualization flexibility — any chart type, any layout
- Handles massive datasets without performance issues
- Strong community with thousands of pre-built templates
- Tableau Public for sharing (though not suitable for confidential executive data)
- Deep drill-down capabilities for data exploration
Limitations:
- Steep learning curve — executives rarely build their own dashboards
- Expensive — Creator licenses start at $75/user/month, Explorer at $42/user/month
- Requires a data warehouse or structured data source
- Sharing with external stakeholders (board, investors) requires Tableau Server or Cloud licenses
- Overkill for simple KPI tracking
Pricing: Creator: $75/user/month. Explorer: $42/user/month. Viewer: $15/user/month. Server/Cloud infrastructure costs additional.
Best fit: Companies with 200+ employees, a dedicated data/analytics team, and complex analytical needs beyond simple KPI dashboards.
3. Microsoft Power BI
Best for: Microsoft-centric organizations that want enterprise BI at a lower price than Tableau
Power BI offers 80% of Tableau's functionality at a fraction of the cost, especially if you're already paying for Microsoft 365. The integration with Excel, Teams, and SharePoint makes it a natural fit for organizations already in the Microsoft ecosystem.
Key strengths:
- Excellent price-to-capability ratio — Pro is $10/user/month
- Tight integration with Microsoft 365 (Excel, Teams, SharePoint)
- Natural language queries (Q&A feature) — executives can ask questions in plain English
- Strong data modeling with DAX
- Embedded analytics for sharing within apps
Limitations:
- Interface is less intuitive than Tableau for complex visualizations
- External sharing requires Power BI Embedded or Premium capacity ($4,995/month)
- Dashboard performance degrades with large datasets unless you optimize data models
- Mobile experience is functional but not great
- Requires some technical knowledge to build effective dashboards
Pricing: Pro: $10/user/month. Premium Per User: $20/user/month. Premium Capacity: starting at $4,995/month.
Best fit: Mid-market to enterprise companies already using Microsoft 365 who want powerful BI without Tableau-level costs. Especially strong for finance teams who live in Excel.
For a deeper look at Power BI for executives, see our Power BI Dashboard Examples guide.
4. Looker (Google Cloud)
Best for: Data-driven companies that want a single source of truth with governed metrics
Looker takes a different approach from Tableau and Power BI. Instead of connecting directly to data sources, Looker uses a modeling layer (LookML) that defines metrics centrally. This means everyone in the organization sees the same numbers, calculated the same way.
Key strengths:
- Single source of truth — metrics are defined once, used everywhere
- Strong governance — no more "my spreadsheet says different numbers than yours"
- Embedded analytics — build dashboards into your own product
- Real-time queries against your data warehouse (no extracts)
- API-first architecture for programmatic access
Limitations:
- Requires a data warehouse (BigQuery, Snowflake, Redshift)
- LookML modeling language has a learning curve
- More expensive than Power BI for similar functionality
- Visualization options are more limited than Tableau
- Google Cloud dependency may not fit every organization
Pricing: Custom pricing — typically $5,000-$10,000+/month depending on users and usage. Contact Google Cloud sales.
Best fit: Technology companies with engineering resources, a data warehouse, and a need for governed, consistent metrics across the organization. Particularly strong for companies building analytics into their own products.
5. Geckoboard
Best for: Small teams that want a simple, always-on TV dashboard in the office
Geckoboard focuses on simplicity. It's designed to create dashboards that display on TVs in your office or shared via live links. No complex data modeling, no learning curve — just connect your tools and build a dashboard in minutes.
Key strengths:
- Fastest setup of any platform on this list — dashboards in 15 minutes
- 90+ native integrations (Salesforce, Google Analytics, Jira, Zendesk, etc.)
- TV mode designed for always-on wall displays
- Dead simple interface — non-technical users can build dashboards
- Automatic data refresh
Limitations:
- Limited customization compared to BI tools
- No drill-down or ad-hoc exploration
- Basic charting options (no advanced visualizations)
- Not designed for board-level reporting or external sharing
- Can get expensive as you add data sources
Pricing: Starting at $49/month for 1 dashboard. Team plan at $99/month for multiple dashboards.
Best fit: Startups and small teams (under 50 people) who want a visible, always-on dashboard for the office. Great for sales floors, marketing war rooms, and engineering team monitors.
6. Klipfolio
Best for: Agencies and consultants who build dashboards for clients
Klipfolio (now part of Klipfolio PowerMetrics) offers both a traditional dashboard builder and a more modern metrics catalog approach. It's particularly popular with agencies because of its white-labeling capabilities and client management features.
Key strengths:
- White-label dashboards for client reporting
- 100+ native data connectors
- PowerMetrics provides a metrics catalog (metrics-as-a-service)
- Good balance of customization and ease of use
- Client management features for agencies
Limitations:
- Interface can feel dated compared to newer tools
- Performance issues with complex dashboards
- PowerMetrics and Klips are two separate products (confusing)
- Support response times can be slow
- Limited advanced analytics (no predictive, no statistical functions)
Pricing: Klipfolio: starting at $125/month. PowerMetrics: starting at $250/month.
Best fit: Marketing agencies and consultants who need to build and share branded dashboards with multiple clients. Also works for internal teams that want a middle ground between Excel and enterprise BI.
7. Databox
Best for: Marketing and sales teams that want automated KPI tracking without a data team
Databox is built for teams that want to track KPIs from multiple tools in one place without building anything custom. It pulls data from 100+ sources and gives you pre-built dashboard templates you can deploy in minutes.
Key strengths:
- 100+ native integrations with popular SaaS tools
- Pre-built templates for common use cases (HubSpot, Google Analytics, Stripe, etc.)
- Goal tracking — set targets and get alerts when you're off track
- Mobile-first design — dashboards look great on phones
- Benchmark data — compare your metrics against industry averages
Limitations:
- Limited customization for complex dashboards
- Data refresh intervals vary by plan (hourly on lower tiers)
- Can't connect to databases or data warehouses directly
- Gets expensive with many data sources
- Not suitable for finance or board-level reporting
Pricing: Free tier available (3 data sources, 3 dashboards). Professional: $72/month. Growth: $135/month.
Best fit: Marketing and sales leaders at companies using HubSpot, Google Analytics, Salesforce, or similar SaaS tools who want automated KPI tracking with minimal setup.
8. Domo
Best for: Enterprise companies that need a full BI platform with executive-friendly features
Domo positions itself as a "business cloud" — a full BI platform that handles everything from data integration to visualization to collaboration. It's enterprise-focused but has a more modern, user-friendly interface than traditional BI tools.
Key strengths:
- 1,000+ data connectors (most of any platform on this list)
- Built-in ETL (data transformation without separate tools)
- Appstore with pre-built dashboard apps
- Strong mobile experience
- AI-powered insights and anomaly detection
- Collaboration features (comments, alerts, tasks on dashboards)
Limitations:
- Expensive — enterprise pricing with annual contracts
- Can be complex to set up and administer
- Requires training for dashboard builders
- Some connectors are basic and need workarounds for complex data
- Lock-in risk — hard to migrate away once you're invested
Pricing: Custom pricing — typically $83/user/month for Standard, with enterprise pricing negotiated. Minimum annual contracts.
Best fit: Enterprise companies (500+ employees) with multiple departments that need a unified BI platform and are willing to invest in proper setup and training.
Comparison Table
| Platform | Best For | Starting Price | Setup Time | External Sharing | Data Sources |
|---|---|---|---|---|---|
| AppDeck | Board/investor sharing | $99/mo | Hours | ✅ Built-in portal | 20+ native |
| Tableau | Deep analytics | $75/user/mo | Weeks | ⚠️ Requires Server | 100+ |
| Power BI | Microsoft shops | $10/user/mo | Days | ⚠️ Requires Premium | 100+ |
| Looker | Governed metrics | ~$5K/mo | Weeks | ⚠️ Requires Embedded | Data warehouse |
| Geckoboard | Office TV dashboards | $49/mo | Minutes | ✅ Live links | 90+ |
| Klipfolio | Agency reporting | $125/mo | Hours | ✅ White-label | 100+ |
| Databox | Marketing/sales KPIs | Free–$72/mo | Minutes | ✅ Shareable links | 100+ |
| Domo | Enterprise BI | ~$83/user/mo | Weeks | ✅ Embedded | 1,000+ |
How to Choose: Decision Framework
Choose AppDeck if:
- You share dashboards with board members, investors, or clients
- You want a branded portal experience, not a BI tool login
- You need unlimited viewers without per-seat costs
- Setup speed matters — you want dashboards this week, not next quarter
Choose Tableau or Power BI if:
- You have a data team that can build and maintain dashboards
- You need complex analytical capabilities (ad-hoc queries, statistical analysis)
- Your primary users are internal analysts and managers
- You already have a data warehouse
Choose Geckoboard or Databox if:
- You're a small team (under 50 people) that wants fast, simple dashboards
- You use popular SaaS tools and want plug-and-play integrations
- You don't have (or need) a data team
- You want dashboards on office TVs or mobile phones
Choose Looker or Domo if:
- You're an enterprise company with multiple departments
- You need governed, consistent metrics across the organization
- You have data engineering resources for setup and maintenance
- You want to embed analytics into your own product
What Executives Actually Want
After building dashboards for 50+ executives, here's what I've learned they care about — which often differs from what the data team thinks they care about:
1. Speed, not depth. Executives want to know "are we on track?" in 5 seconds, not explore data for 30 minutes. Choose software that optimizes for summary views.
2. Mobile access. CEOs check dashboards on their phone at 6 AM, not on a desktop during business hours. Mobile experience matters more than you think.
3. One place. Executives hate logging into multiple tools. The dashboard that consolidates everything into a single view wins, even if each individual metric could be seen in its source tool.
4. Alerts, not logins. The best dashboard sends you a notification when something needs attention. The worst requires you to remember to open it.
5. Shareability. Every executive eventually needs to share their dashboard with someone — a board member, an investor, an advisor. Tools that make sharing easy get used; tools that make it hard get abandoned.
Frequently Asked Questions
What is executive dashboard software?
Executive dashboard software is a category of business intelligence and reporting tools designed for the way leaders consume information: high-level summary views of company performance, real-time KPI tracking, mobile access, and shareability with board members or investors. Unlike traditional BI tools optimized for analysts (Tableau, Power BI, Looker), executive dashboard platforms prioritize speed-to-insight over analytical depth. The user is usually a CEO, CFO, COO, or board member who has 30 seconds to check "are we on track?" — not 30 minutes to explore data.
Is Tableau or Power BI better for executive dashboards?
Power BI tends to win for organizations standardized on Microsoft 365, with lower per-user cost ($10/user/month vs. $75 for Tableau Creator) and tight integration with Excel, Teams, and Azure. Tableau wins on visualization sophistication and is the better choice when your analysts need to build complex, custom views. For pure executive consumption, both are overkill — executives rarely use 10% of what either tool offers, and most refuse to log into a BI interface at all. Many companies end up running Tableau or Power BI for internal analysts plus a lightweight executive dashboard layer (AppDeck, Geckoboard, Databox) for leadership and board reporting.
How much does executive dashboard software cost?
Pricing splits into three tiers. Enterprise BI platforms (Tableau, Looker, Domo) run $70-$5,000+ per month with significant implementation costs ($25K-$150K all-in for the first year). Mid-market tools (Power BI, Klipfolio, AppDeck) range from $10-$300 per month per user or per workspace, with implementation usually under $10K. Lightweight dashboard tools (Geckoboard, Databox) cost $25-$72/month and self-implement in a day. The hidden cost is data preparation: regardless of tool, expect 60-100 hours of work mapping data sources, defining metrics, and building the initial dashboard set.
Who should use executive dashboard software versus board management software?
Executive dashboard software is for ongoing operational visibility — daily, weekly, monthly KPI tracking by the leadership team. Board management software (Diligent, BoardEffect, OnBoard) handles the discrete artifacts of governance: meeting packets, minutes, resolutions, director onboarding. Many CEOs use both: an executive dashboard for the live metrics view they share with their leadership team and board observers, and a board portal for the formal quarterly meeting packet. Confusion arises because some board portals include reporting features, but those are usually static document libraries, not live dashboards.
When should we skip executive dashboard software entirely?
Skip if your leadership team is under 10 people and a weekly KPI email or shared Google Sheet does the job. The dashboard tool only pays off when you have a recurring leadership cadence (weekly executive meeting, monthly board update, quarterly business review) where consistent, current data matters more than the manual cost of refreshing it. Also skip dashboard investment if your data is in such poor shape that nobody trusts the numbers — fix data quality first. A dashboard built on bad data accelerates wrong decisions faster than no dashboard at all.
Conclusion
The right executive dashboard software depends on three things: who's looking at it, how technical your team is, and whether you need to share it externally.
For most companies under 200 employees who need to share dashboards with board members or investors, a purpose-built platform like AppDeck will get you up and running faster and cheaper than enterprise BI tools. You can always migrate to Tableau or Looker later when your data needs outgrow simpler tools.
For enterprises with data teams, Tableau and Power BI remain the most capable options. And for small teams that just want a simple dashboard on the wall, Geckoboard and Databox get the job done without the overhead.
Start with your audience. Build for them, not for your data team. The best dashboard is the one your executives actually open.
Related reading:
- The Complete Guide to Executive Dashboards
- Executive Dashboard Templates: 12 Free Examples
- 15 Free Excel Dashboard Templates
- Power BI Dashboard Examples for Executives
- KPI Dashboard Examples for Every Business Function

Founder & CEO, AppDeck
Serial entrepreneur with 20+ years building B2B software companies. Former executive managing 2,800+ employees across three continents. Vik reviews all AppDeck content for accuracy and practical relevance.
Share this article
Explore Related Solutions
Related Articles
15 Free Excel Dashboard Templates You Can Download Today
Download 15 free Excel dashboard templates for executives, finance, sales, marketing, and operations. Ready-to-use .xlsx files with sample data, charts, and formulas.
Executive Dashboard Templates: 12 Free Examples for CEOs, CFOs & CROs
Ready-to-use executive dashboard templates for tracking KPIs, financials, and team performance. Free examples with best practices from real companies.
Executive Summary Dashboard: What to Include, How to Build It, and Examples
Learn how to build an executive summary dashboard that drives decisions. Key metrics, layout best practices, real examples, and a step-by-step guide for CEOs, CFOs, and VPs.