
Vendor Scorecard Template: How to Evaluate and Track Supplier Performance
Free vendor scorecard template with scoring criteria, KPIs, and examples. Learn how to build a vendor evaluation system that improves supplier quality and reduces risk.
Download the template: Get this scorecard as a free Word doc — Vendor Scorecard Template (.docx) — pre-built scoring rubric, weighted criteria, anchor definitions, and tier classification. No paywall.
Most companies manage dozens of vendor relationships. A few manage hundreds. But when I ask procurement leaders how they actually evaluate those vendors, the answer is usually some combination of "gut feeling," a spreadsheet someone built three years ago, or "we wait until something goes wrong."
That reactive approach is expensive. Research from Deloitte and the Hackett Group consistently shows that companies with formal vendor evaluation programs save 12-18% on procurement costs. Not because the scorecards themselves are magic — but because the discipline of measuring vendor performance forces better conversations, faster course corrections, and smarter renewal decisions.
A vendor scorecard gives you a structured, repeatable way to assess every supplier against the same criteria. It replaces "I think they're doing fine" with "here's exactly where they're strong and where they're falling short."
In this guide, I'll walk you through a complete vendor scorecard template you can use immediately, the specific vendor performance metrics worth tracking, and real examples across different vendor types. Whether you're building your first scorecard or overhauling an existing process, this is the framework I recommend.
What Is a Vendor Scorecard?
A vendor scorecard is a standardized evaluation tool that measures supplier performance across multiple categories using defined KPIs and a consistent scoring system. Think of it as a report card for your vendors — except instead of grades in math and English, you're scoring quality, delivery, cost, compliance, and communication.
Who uses vendor scorecards?
- Procurement and sourcing teams evaluating supplier performance
- Operations managers tracking delivery and quality metrics
- IT leaders assessing technology vendor SLAs
- Finance teams monitoring cost compliance and invoice accuracy
- Risk and compliance officers reviewing regulatory adherence
When should you use a vendor scorecard?
You need a vendor scorecard any time you have recurring vendor relationships where performance matters. That includes:
- Quarterly business reviews (QBRs) — The scorecard provides the agenda and the data
- Contract renewals — Objective performance data strengthens your negotiating position
- Vendor consolidation — Compare vendors side by side using the same criteria
- Risk management — Identify underperforming vendors before problems escalate
- New vendor onboarding — Set expectations from day one about how performance will be measured
If you're spending more than $50,000 annually with a vendor, you should be scoring them. Period.
5 Core Vendor Scorecard Categories
Every vendor scorecard should evaluate performance across five fundamental categories. The specific KPIs within each category will vary depending on your industry and vendor type, but these five pillars remain consistent.
1. Quality
Quality measures whether the vendor delivers what they promised at the standard they promised. This is typically the highest-weighted category because quality failures cascade into every other area of your business.
Key KPIs:
- Defect rate (percentage of deliverables with quality issues)
- First-pass yield (percentage accepted without rework)
- Customer complaint rate attributed to vendor
- Specification compliance rate
- Corrective action response time
2. Delivery
Delivery measures whether the vendor meets their commitments on time and in full. Late deliveries disrupt your operations, delay your projects, and erode trust.
Key KPIs:
- On-time delivery rate
- Lead time accuracy (quoted vs. actual)
- Order fill rate (complete orders vs. partial shipments)
- Expedite request frequency
- Delivery documentation accuracy
3. Cost
Cost measures whether the vendor provides competitive pricing and maintains cost discipline over time. This is not just about being the cheapest — it's about transparency, accuracy, and value.
Key KPIs:
- Price competitiveness vs. market benchmarks
- Invoice accuracy rate
- Cost variance (actual vs. quoted)
- Cost reduction initiatives proposed
- Total cost of ownership trend
4. Compliance
Compliance measures whether the vendor meets regulatory, contractual, and policy requirements. In regulated industries, this category often carries the heaviest weight.
Key KPIs:
- Regulatory compliance status
- Contract terms adherence
- Insurance and certification currency
- Data security and privacy compliance
- Audit finding resolution rate
5. Relationship and Communication
This category measures the intangible but critical aspects of working with a vendor — responsiveness, transparency, and willingness to collaborate on problem-solving.
Key KPIs:
- Response time to inquiries
- Escalation resolution speed
- Proactive communication frequency
- Account management stability (turnover)
- Innovation and improvement suggestions
Vendor Scorecard Template
Here is a complete vendor scorecard template you can adapt for your organization. Each category is weighted based on importance, and each KPI is scored on a 1-5 scale.
============================================================
VENDOR SCORECARD
============================================================
Vendor Name: ___________________    Review Period: __________
Evaluator:   ___________________    Date:          __________
Contract Value: ________________    Vendor Tier:   __________

SCORING SCALE:
  1 = Unacceptable   2 = Below Expectations   3 = Meets Expectations
  4 = Exceeds Expectations   5 = Outstanding

============================================================
CATEGORY 1: QUALITY (Weight: 30%)
============================================================
KPI                              Score (1-5)    Notes
------------------------------------------------------------
Defect rate                      [___]          ____________
First-pass yield                 [___]          ____________
Specification compliance         [___]          ____________
Customer complaints (vendor)     [___]          ____________
Corrective action response       [___]          ____________
------------------------------------------------------------
Category Average:                [___]
Weighted Score (avg x 0.30):     [___]

============================================================
CATEGORY 2: DELIVERY (Weight: 25%)
============================================================
KPI                              Score (1-5)    Notes
------------------------------------------------------------
On-time delivery rate            [___]          ____________
Lead time accuracy               [___]          ____________
Order fill rate                  [___]          ____________
Expedite frequency               [___]          ____________
Documentation accuracy           [___]          ____________
------------------------------------------------------------
Category Average:                [___]
Weighted Score (avg x 0.25):     [___]

============================================================
CATEGORY 3: COST (Weight: 20%)
============================================================
KPI                              Score (1-5)    Notes
------------------------------------------------------------
Price competitiveness            [___]          ____________
Invoice accuracy                 [___]          ____________
Cost variance (quoted vs actual) [___]          ____________
Cost reduction initiatives       [___]          ____________
Total cost of ownership trend    [___]          ____________
------------------------------------------------------------
Category Average:                [___]
Weighted Score (avg x 0.20):     [___]

============================================================
CATEGORY 4: COMPLIANCE (Weight: 15%)
============================================================
KPI                              Score (1-5)    Notes
------------------------------------------------------------
Regulatory compliance            [___]          ____________
Contract terms adherence         [___]          ____________
Insurance/certification status   [___]          ____________
Data security compliance         [___]          ____________
Audit finding resolution         [___]          ____________
------------------------------------------------------------
Category Average:                [___]
Weighted Score (avg x 0.15):     [___]

============================================================
CATEGORY 5: RELATIONSHIP (Weight: 10%)
============================================================
KPI                              Score (1-5)    Notes
------------------------------------------------------------
Response time                    [___]          ____________
Escalation resolution            [___]          ____________
Proactive communication          [___]          ____________
Account management stability     [___]          ____________
Innovation suggestions           [___]          ____________
------------------------------------------------------------
Category Average:                [___]
Weighted Score (avg x 0.10):     [___]

============================================================
OVERALL SCORE
============================================================
Quality Weighted Score:          [___]
Delivery Weighted Score:         [___]
Cost Weighted Score:             [___]
Compliance Weighted Score:       [___]
Relationship Weighted Score:     [___]
------------------------------------------------------------
TOTAL WEIGHTED SCORE:            [___] / 5.00

RATING:
  4.5 - 5.0  ✅ Strategic Partner
  3.5 - 4.4  ✅ Preferred Vendor
  2.5 - 3.4  ⚠️  Needs Improvement (action plan required)
  1.0 - 2.4  ❌ At Risk (escalation required)

ACTION ITEMS:
1. ________________________________________________
2. ________________________________________________
3. ________________________________________________

NEXT REVIEW DATE: ________________
Adjust the category weights based on what matters most to your business. A manufacturing company might weight Quality at 40% and Relationship at 5%. A professional services firm might weight Relationship at 25% and Cost at 15%. The template is a starting point — make it yours.
How to Score Vendors: Step by Step
Building a vendor scorecard is straightforward. The hard part is maintaining the discipline to use it consistently. Here's the five-step process I recommend.
Step 1: Define Your Evaluation Criteria
Start with the five core categories above, then customize the specific KPIs for each vendor type. Not every KPI applies to every vendor. A cloud software provider doesn't have a "defect rate" in the traditional sense, but they do have uptime SLAs and bug resolution metrics.
Involve stakeholders from the teams that interact with the vendor daily. Procurement might care about cost, but operations cares about delivery, and IT cares about security compliance. Build a scorecard that reflects all perspectives.
Step 2: Assign Category Weights
Weights should reflect your strategic priorities, not just your preferences. Ask yourself: "If this vendor failed in this category, how much would it impact our business?"
A common starting point:
- Quality: 30%
- Delivery: 25%
- Cost: 20%
- Compliance: 15%
- Relationship: 10%
But these should vary by vendor tier. For a critical sole-source supplier, compliance and quality might together account for 60% of the score. For a commodity vendor with multiple alternatives, cost might carry 35%.
Step 3: Collect Performance Data
This is where most scorecard programs stall. You need actual data, not opinions. Sources include:
- Your systems — ERP, procurement software, ticketing systems, and project management tools all contain delivery, quality, and cost data
- The vendor — Request self-reported metrics as part of QBR preparation
- Your teams — Structured surveys for subjective categories like communication and relationship quality
- Third parties — Industry benchmarks, compliance audit reports, financial health data
Set up data collection processes before you need them. If you wait until scorecard review day to start gathering data, you'll end up guessing — which defeats the purpose.
Step 4: Calculate Weighted Scores
For each category, average the individual KPI scores, then multiply by the category weight.
Example calculation:
If a vendor scores an average of 4.2 in Quality (weighted at 30%), the weighted score is:
4.2 x 0.30 = 1.26
Sum all five weighted scores to get the total. The maximum possible score is 5.00.
Step 5: Review Quarterly and Take Action
A scorecard that sits in a drawer is worthless. Schedule quarterly reviews with every strategic vendor and use the scorecard as the centerpiece of the conversation.
For vendors scoring below 3.0 in any category, create a formal improvement plan with specific milestones and a 90-day review. For vendors consistently scoring above 4.5, explore ways to deepen the partnership — preferred pricing, joint innovation projects, or expanded scope.
Vendor Performance Metrics: 20 KPIs to Track
Here are 20 specific vendor KPIs organized by category, with formulas where applicable. Choose the ones most relevant to your vendor relationships.
Quality Metrics
- Defect Rate = (Defective units / Total units delivered) x 100
- First-Pass Yield = (Units accepted on first inspection / Total units inspected) x 100
- Return Rate = (Units returned / Total units delivered) x 100
- Corrective Action Cycle Time = Average days from issue reported to resolution confirmed
Delivery Metrics
- On-Time Delivery Rate = (On-time deliveries / Total deliveries) x 100
- Lead Time Variance = (Actual lead time - Quoted lead time) / Quoted lead time x 100
- Order Fill Rate = (Complete orders shipped / Total orders) x 100
- Perfect Order Rate = (Orders delivered on time, in full, damage-free, with correct documentation / Total orders) x 100
Cost Metrics
- Invoice Accuracy Rate = (Accurate invoices / Total invoices) x 100
- Cost Variance = (Actual cost - Budgeted cost) / Budgeted cost x 100
- Year-over-Year Price Change = (Current period price - Prior period price) / Prior period price x 100
- Payment Terms Compliance = Percentage of invoices paid within agreed terms
Compliance Metrics
- Regulatory Compliance Score = Percentage of applicable regulations met
- Contract Compliance Rate = (Compliant deliverables / Total deliverables) x 100
- Certification Currency = Number of days until next certification expiration
- Security Incident Count = Number of data security or privacy incidents per period
Relationship Metrics
- Average Response Time = Average hours from inquiry to initial response
- Escalation Resolution Time = Average days from escalation to resolution
- Account Manager Retention = Months of consistent account management without turnover
- Net Promoter Score (Internal) = Survey your teams: "How likely are you to recommend continuing with this vendor?"
You don't need all 20 from day one. Start with the five or six that matter most, then expand as your program matures.
Vendor Scorecard Examples
Here are three completed vendor scorecard examples for different vendor types.
Example 1: IT Managed Services Vendor
============================================================
VENDOR SCORECARD — IT MANAGED SERVICES
============================================================
Vendor: TechServe Solutions         Review Period: Q1 2026
Contract Value: $180,000/year       Vendor Tier: Strategic

QUALITY (Weight: 30%)                          Avg: 4.0
  System uptime (SLA: 99.9%)           4    — 99.92% achieved
  Ticket resolution quality            4    — 94% first-contact resolution
  Security patch compliance            5    — All patches within 48 hrs
  Incident root cause analysis         3    — Reports often delayed
  Weighted Score:                      1.20

DELIVERY (Weight: 25%)                         Avg: 3.8
  SLA response time compliance         4    — 97% within SLA
  Project milestone delivery           3    — 2 of 8 milestones late
  Change request turnaround            4    — Avg 2.1 days
  Documentation delivery               4    — Complete and timely
  Weighted Score:                      0.95

COST (Weight: 20%)                             Avg: 3.6
  Invoice accuracy                     4    — 98% accurate
  Budget variance                      3    — 6% over on projects
  Rate competitiveness                 4    — In line with market
  Cost optimization suggestions        3    — Minimal proactive ideas
  Weighted Score:                      0.72

COMPLIANCE (Weight: 15%)                       Avg: 4.6
  SOC 2 compliance                     5    — Current certification
  Data privacy (GDPR/CCPA)            5    — Full compliance
  Contract terms adherence             4    — Minor SLA gaps
  Insurance currency                   4    — All policies current
  Weighted Score:                      0.69

RELATIONSHIP (Weight: 10%)                     Avg: 3.4
  Response time                        4    — Same-day responses
  Escalation handling                  3    — Slow on P1 issues
  Proactive communication              3    — Reactive, not proactive
  Account manager stability            4    — Same AM for 18 months
  Weighted Score:                      0.34

TOTAL SCORE: 3.90 / 5.00 — ✅ Preferred Vendor
ACTION: Address project milestone delays and P1 escalation speed
Example 2: Manufacturing Component Supplier
============================================================
VENDOR SCORECARD — MANUFACTURING SUPPLIER
============================================================
Vendor: PrecisionParts Co.          Review Period: Q1 2026
Contract Value: $420,000/year       Vendor Tier: Critical

QUALITY (Weight: 35%)                          Avg: 4.4
  Defect rate (target: under 1%)       5    — 0.3% defect rate
  First-pass yield                     4    — 97.2% accepted
  Spec compliance                      5    — Zero spec deviations
  Corrective action response           4    — Avg 5 days (target 7)
  Weighted Score:                      1.54

DELIVERY (Weight: 30%)                         Avg: 3.4
  On-time delivery rate                3    — 88% (target 95%)
  Lead time accuracy                   3    — Avg 3 days late
  Order fill rate                      4    — 96% complete orders
  Perfect order rate                   3    — 82% perfect orders
  Weighted Score:                      1.02

COST (Weight: 15%)                             Avg: 4.0
  Price competitiveness                4    — 5% below market avg
  Invoice accuracy                     4    — 97% accurate
  Year-over-year change                4    — 2.1% increase (below CPI)
  Cost reduction proposals             4    — 2 proposals this quarter
  Weighted Score:                      0.60

COMPLIANCE (Weight: 15%)                       Avg: 4.2
  ISO 9001 certification               5    — Current
  RoHS/REACH compliance                4    — Compliant, minor docs gap
  Contract terms adherence             4    — One missed reporting deadline
  Audit readiness                      4    — Clean last audit
  Weighted Score:                      0.63

RELATIONSHIP (Weight: 5%)                      Avg: 4.0
  Response time                        4    — Under 4 hours avg
  Technical support quality            4    — Strong engineering team
  Proactive communication              4    — Weekly status updates
  Innovation collaboration             4    — Joint cost-down project
  Weighted Score:                      0.20

TOTAL SCORE: 3.99 / 5.00 — ✅ Preferred Vendor
ACTION: On-time delivery is the critical gap — require root cause
         analysis and improvement plan by end of Q2
Example 3: Professional Services Vendor (Marketing Agency)
============================================================
VENDOR SCORECARD — PROFESSIONAL SERVICES
============================================================
Vendor: BrightSpark Agency          Review Period: Q1 2026
Contract Value: $96,000/year        Vendor Tier: Standard

QUALITY (Weight: 25%)                          Avg: 2.8
  Deliverable quality                  3    — Frequent revision cycles
  Strategic value of recommendations   3    — Adequate, not exceptional
  Brand guideline compliance           3    — Minor inconsistencies
  Error rate in deliverables           2    — Typos and data errors
  Weighted Score:                      0.70

DELIVERY (Weight: 20%)                         Avg: 2.6
  On-time delivery                     2    — 70% on time
  Scope management                     3    — Reasonable scope control
  Milestone adherence                  3    — Most milestones met
  Revision turnaround                  3    — 2-3 day turnaround
  Weighted Score:                      0.52

COST (Weight: 20%)                             Avg: 3.0
  Budget adherence                     3    — On budget overall
  Invoice accuracy                     3    — Occasional line item errors
  Value for spend                      3    — Market rate, average output
  Scope creep billing                  3    — Transparent on extras
  Weighted Score:                      0.60

COMPLIANCE (Weight: 10%)                       Avg: 3.5
  NDA/confidentiality                  4    — No issues
  Data handling practices              3    — Adequate
  Contract terms adherence             4    — Compliant
  Insurance/liability                  3    — Current but minimal
  Weighted Score:                      0.35

RELATIONSHIP (Weight: 25%)                     Avg: 3.2
  Responsiveness                       3    — 24-48 hr response time
  Proactive strategy input             3    — Mostly reactive
  Team stability                       4    — Consistent team
  Reporting and transparency           3    — Monthly reports, basic
  Weighted Score:                      0.80

TOTAL SCORE: 2.97 / 5.00 — ⚠️ Needs Improvement
ACTION: Issue formal improvement plan. Key gaps in quality and
         delivery. If no improvement by Q3, begin vendor transition.
Notice how the same framework works across completely different vendor types. The categories and weights shift, but the structure and scoring system remain consistent. That consistency is what makes vendor scorecards powerful for comparing and managing your entire supplier base.
Common Mistakes to Avoid
I've seen plenty of vendor scorecard programs fail. Here are the five most common reasons — and how to avoid them.
1. Scoring Without Data
The most common mistake is treating the scorecard like a survey instead of a measurement tool. When evaluators score based on feelings rather than data, you get inconsistent results that vendors can (rightfully) challenge. For every KPI on your scorecard, define the data source before you start scoring.
2. Using the Same Weights for Every Vendor
A strategic sole-source supplier and a commodity vendor with five alternatives should not be scored with the same category weights. Customize weights by vendor tier and type. What matters most varies dramatically depending on the relationship.
3. Scoring Once and Filing It Away
A scorecard reviewed annually is barely better than no scorecard at all. Quarterly reviews are the minimum cadence for strategic vendors. The value comes from the trend over time, not any single snapshot.
4. No Consequences for Low Scores
If a vendor consistently scores below 3.0 and nothing happens, the entire program loses credibility — both internally and with your vendors. Define clear escalation paths: improvement plans, executive reviews, and ultimately, vendor replacement timelines.
5. Making It Too Complex
I've seen scorecards with 50 KPIs across 12 categories. Nobody fills those out accurately. Keep it to 20-25 KPIs across five categories. You can always add complexity later, but you can't recover from a program that people abandon because it's too burdensome.
Tools for Vendor Scorecards
You have several options for implementing vendor scorecards, depending on your organization's size and complexity.
Spreadsheets (Excel or Google Sheets) work fine for small vendor portfolios with fewer than 20 suppliers. Use the template above as your starting point. The limitation is that spreadsheets don't scale well — version control, collaboration, and historical tracking become painful quickly.
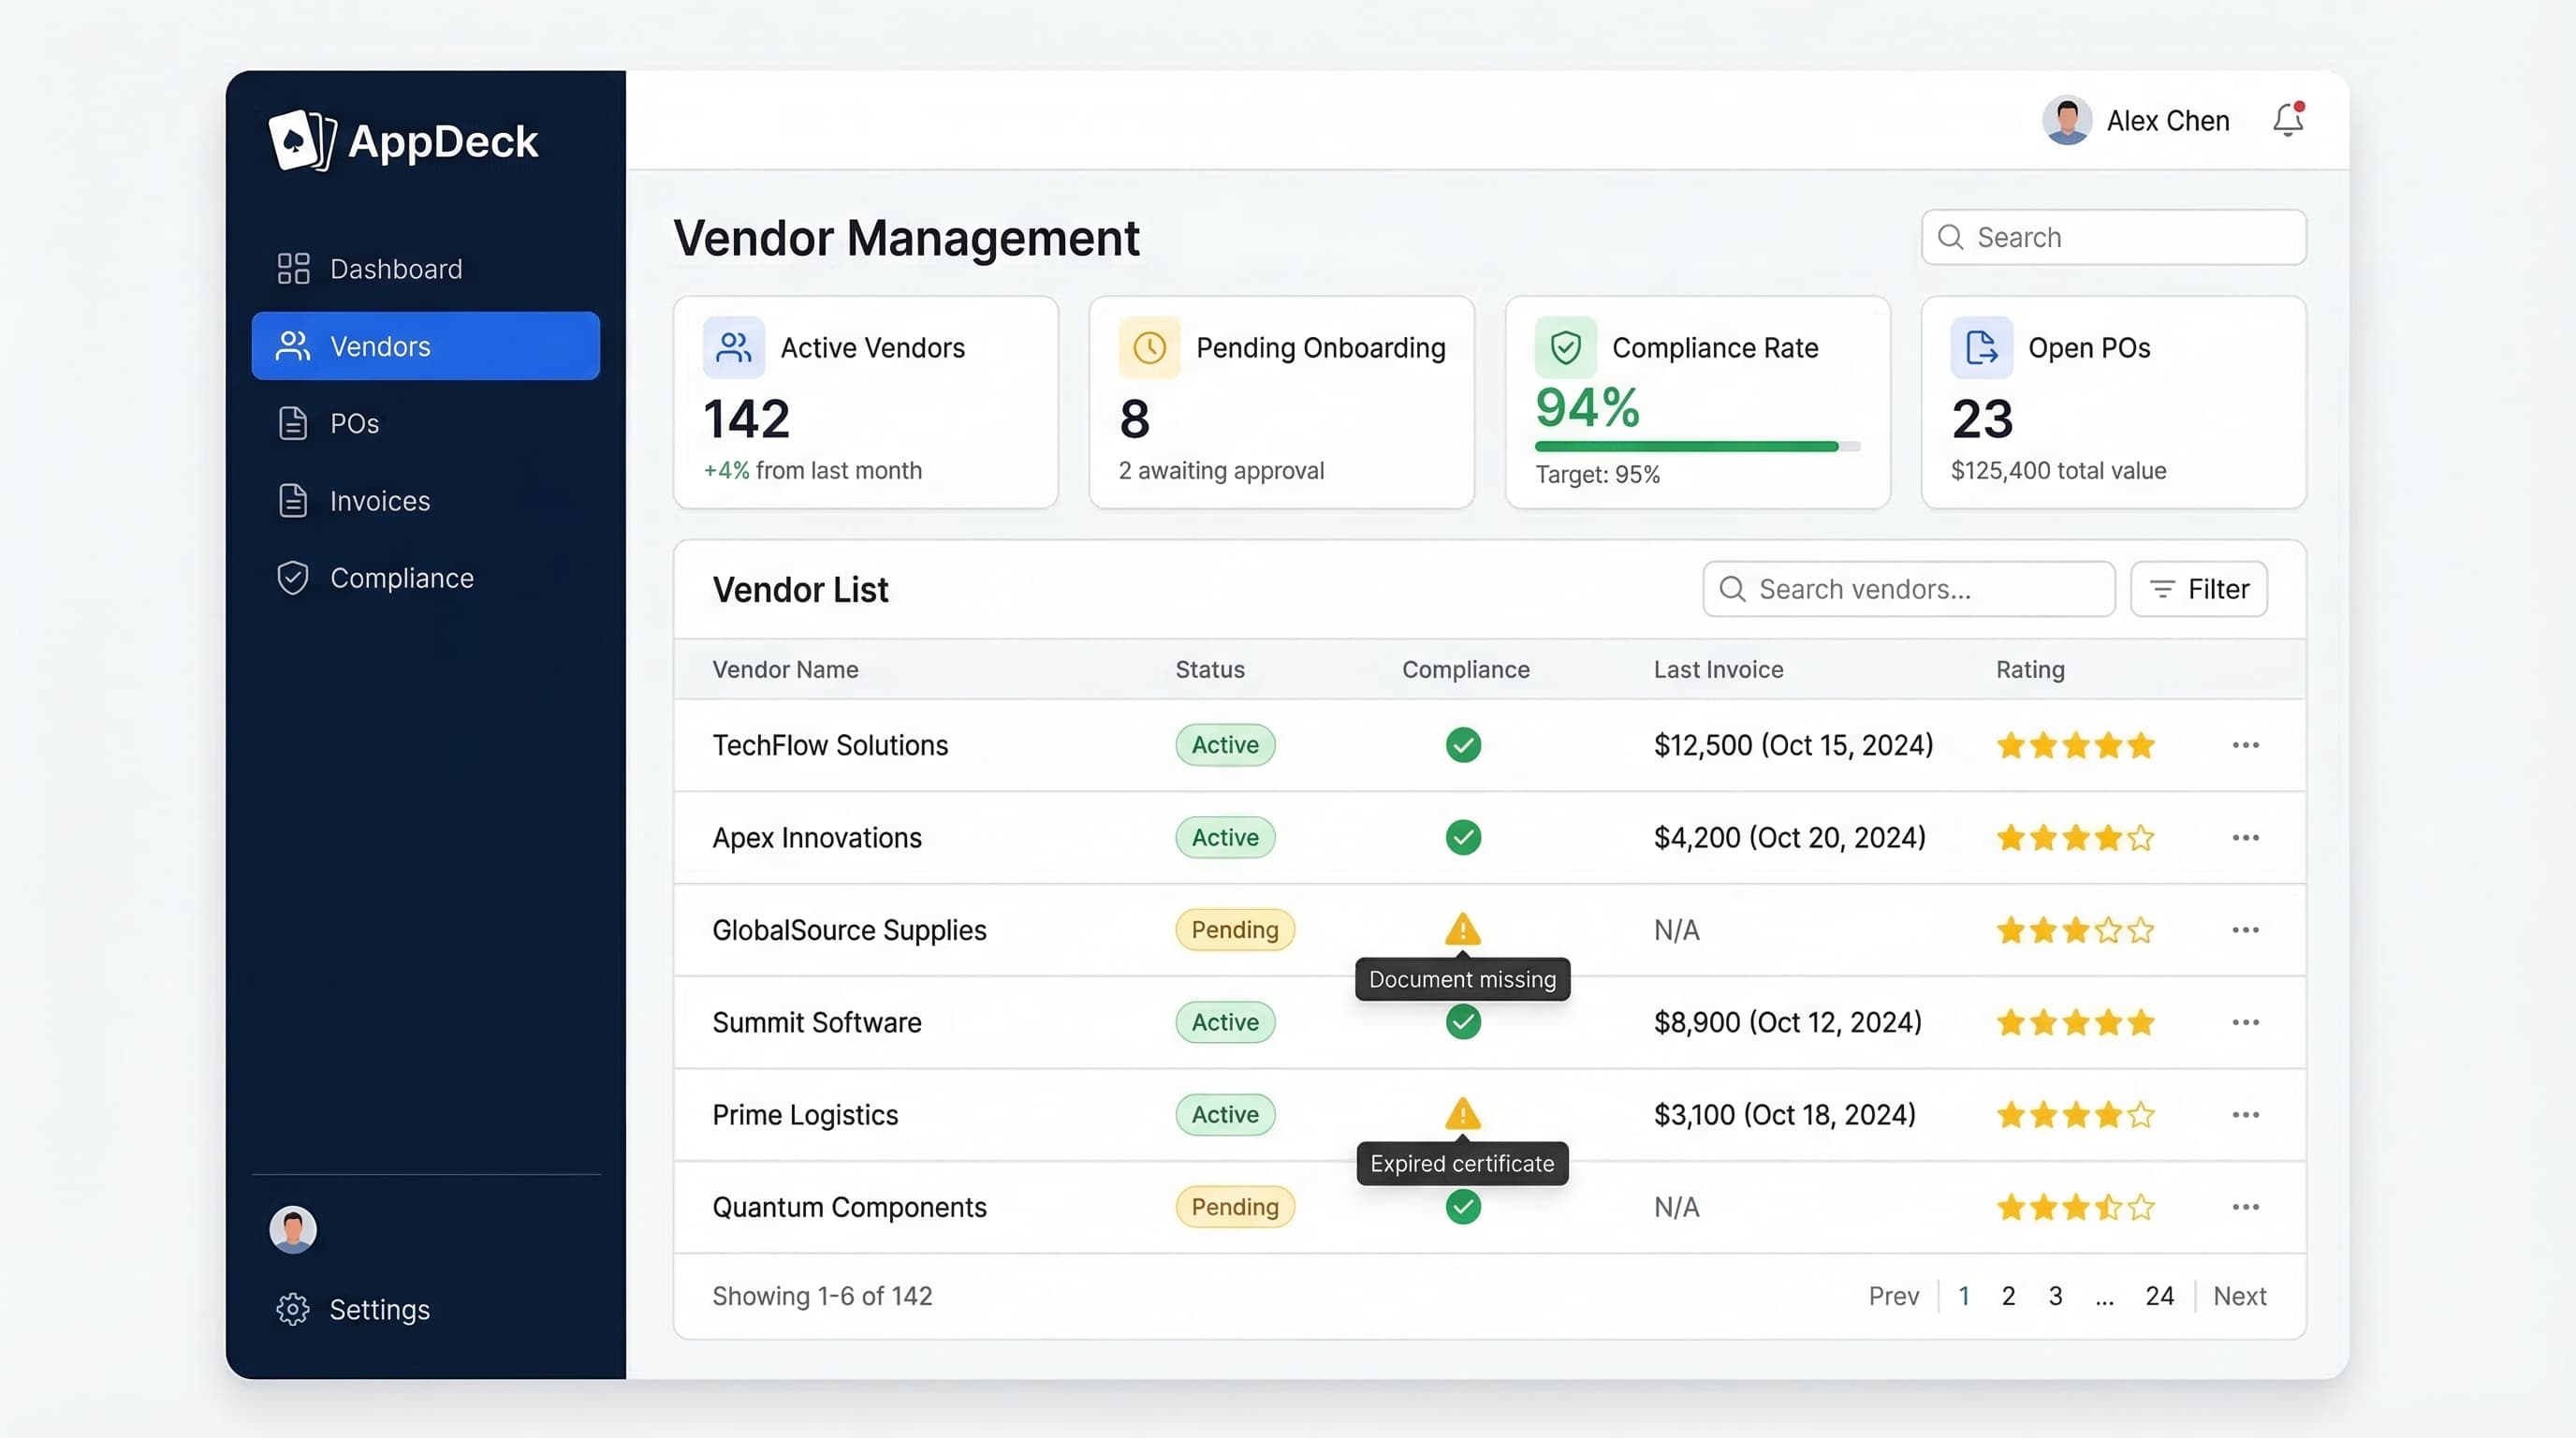
Vendor portals are a better option once you're managing more than a handful of vendors. A platform like AppDeck's vendor portal lets you centralize scorecard data, share results with vendors directly, track improvement plans, and maintain a complete performance history. Vendors can also self-report metrics, which reduces your data collection burden.
Dedicated procurement platforms like Coupa, SAP Ariba, or Jaggaer include vendor scoring modules as part of their broader procurement suites. These make sense for enterprise organizations with large, complex supply chains, but they're overkill for most mid-market companies.
My recommendation: start with a spreadsheet to prove the concept and refine your criteria. Once you've run two or three quarterly cycles and know what works, move to a vendor portal that automates the process and gives your vendors visibility into their own performance.
Frequently Asked Questions
What is a vendor scorecard?
A vendor scorecard is a structured evaluation tool that measures supplier performance across defined categories — typically quality, delivery, cost, service, and relationship — using objective metrics and a consistent scoring scale. It produces a quantitative score per vendor per period (usually quarterly) that drives performance conversations, contract decisions, and category rationalization. Unlike a risk assessment (which evaluates exposure) or a compliance checklist (which verifies documentation), a scorecard measures how well a vendor is actually delivering against the operational commitments in your contract. Done well, it turns subjective "is this vendor good?" debates into data-driven reviews both sides can act on.
How is a vendor scorecard different from a vendor risk assessment?
A scorecard measures performance — how well the vendor delivers — using metrics like on-time delivery rate, defect rate, invoice accuracy, response time, and cost variance. A risk assessment measures exposure — how likely things are to go wrong — across financial health, security posture, regulatory compliance, and operational resilience. A vendor can have a great scorecard (delivering well today) and a bad risk profile (financially distressed, so might collapse tomorrow). You need both: scorecards for ongoing performance management and remediation, risk assessments for engagement decisions and monitoring intensity. They feed different conversations and trigger different actions.
How often should we score vendors and review the results?
Score quarterly for most strategic and Tier 1 vendors, semiannually for Tier 2, and annually for commodity Tier 3 vendors. Run quarterly business reviews (QBRs) with strategic vendors to walk through scorecard results, root-cause issues, and agree on improvement plans. The data collection cadence behind scorecards should be continuous — capture on-time delivery, defect rates, and response times in real time as transactions happen — but the formal scorecard publication and review happens quarterly. Don't try to run formal scorecards monthly; the data noise is too high and you'll burn vendor goodwill on minor variance discussions.
Who should use vendor scorecards?
Vendor scorecards are most valuable for procurement teams managing 30+ active vendors, manufacturers with supplier-dependent operations, services companies with subcontractor networks, and any organization where vendor performance directly affects customer experience (logistics, IT operations, healthcare delivery). Small companies under 20 vendors usually don't need formal scorecards — relationship-based reviews are sufficient. The threshold is roughly when no single person can hold accurate performance assessments for every vendor in their head and decisions start being made on impression rather than evidence. Scorecards force the conversation back to data.
When should we move from a spreadsheet scorecard to a portal-based system?
Move to portal-based scoring when one of these signals appears: (1) you're managing more than 30-50 active vendors and the spreadsheet has become unmaintainable, (2) you want vendors to see their own scores in real time as a self-service performance signal, or (3) you need historical trend analysis across multiple quarters that pivot tables can't deliver cleanly. Spreadsheets work great for the first 2-3 scoring cycles while you refine criteria and weights. Once the methodology is stable and vendor count is growing, move to a vendor portal or procurement platform that automates data collection and gives both sides a shared view.
Conclusion
A vendor scorecard is one of the highest-leverage tools in procurement. It takes a subjective process — "how's our vendor doing?" — and turns it into an objective, data-driven conversation that both sides can act on.
Start with the template in this guide. Customize the categories and weights for your most important vendors. Run your first scoring cycle within the next 30 days. You'll be surprised at how quickly the data reveals which vendors are truly earning their contracts — and which ones are coasting on inertia.
The companies that manage vendors well don't just save money. They build a supply base that actively contributes to their competitive advantage. A vendor scorecard is where that discipline starts.
Related reading:

Founder & CEO, AppDeck
Serial entrepreneur with 20+ years building B2B software companies. Former executive managing 2,800+ employees across three continents. Vik reviews all AppDeck content for accuracy and practical relevance.
Share this article
Explore Related Solutions
Related Articles
Vendor Compliance Checklist: 30 Items Every Procurement Team Needs
Complete vendor compliance checklist for procurement teams. Track certifications, insurance, licenses, contracts, and regulatory requirements with automated reminders.
Vendor Management Best Practices: Complete Guide for 2026
15 vendor management best practices for procurement teams. Covers onboarding, compliance, performance tracking, risk management, and technology.
Vendor Onboarding Process: Step-by-Step Guide for 2026
Complete vendor onboarding process guide. 7-step framework from initial contact to active vendor status with checklists, timelines, and automation tips.