
Project Status Dashboard: How to Build One That Teams Actually Use
Learn how to build a project status dashboard that keeps stakeholders informed without endless status meetings. Templates, metrics, examples, and tool recommendations.
Download the template: Get the dashboard as a free Excel file — Project Status Dashboard Template (.xlsx) — RAG status, milestone schedule, budget variance, and risk register on sample data. No paywall.
Here is a stat that should make every project manager uncomfortable: the average PM spends roughly 30% of their working hours on status reporting. Not managing risks. Not unblocking the team. Not talking to stakeholders about strategy. Just answering the question, "Where are we on this?"
I have lived this. At one point I was running three client projects simultaneously, and my Mondays were entirely consumed by preparing status decks, running update calls, and then sending recap emails that nobody read. The irony was painful — I was so busy reporting on the project that I barely had time to actually manage it.
A well-built project status dashboard eliminates most of that overhead. Instead of preparing slides and scheduling calls, you point people to a single source of truth that updates itself. The right dashboard does not just save you time. It changes how your entire team communicates about work.
In this guide, I will walk through exactly what makes a project status dashboard effective, show you five real layout examples, cover the metrics that matter, and give you a step-by-step process for building one. Whether you need an internal dashboard for your engineering team or a client-facing portal for your agency, the principles are the same.
What Is a Project Status Dashboard?
A project status dashboard is a visual, real-time summary of a project's health, progress, and key metrics. Think of it as the answer to every question a stakeholder might ask about your project, presented on a single screen (or at most, two).
At its core, a project management dashboard pulls data from wherever your team tracks work — your PM tool, time tracker, budget spreadsheet, issue tracker — and presents it in a format that anyone can understand in under 30 seconds.
There are two broad audiences for a project dashboard:
Internal teams need dashboards that show the full picture: who is working on what, where the blockers are, whether the team is on pace. These dashboards are detailed and operational.
External stakeholders — clients, executives, board members — need a curated view. They care about progress, timeline, budget, and risks. They do not need to see every Jira ticket or know that your backend developer called in sick on Tuesday. (For C-suite and board-level dashboards specifically, see executive dashboard software.)
The best project dashboards serve both audiences, often from the same underlying data but with different views and access levels.
Internal vs. Client-Facing Dashboards
This distinction matters more than most people realize. I have seen agencies share their raw Asana boards with clients and wonder why the client panics about every yellow-flagged task. I have also seen teams keep everything internal and then field 15 "just checking in" emails a week from their client.
Here is how the two differ:
Internal project dashboards are built for the people doing the work. They tend to include granular task-level detail, individual assignments and workload, technical metrics like velocity or code coverage, internal notes and blockers, and unfiltered risk assessments. The goal is operational visibility. You want the team to spot problems early and self-correct without waiting for a status meeting.
Client-facing project dashboards are built for people who need to know that things are on track without getting lost in the details. These typically show high-level progress with milestone markers, a clear health indicator (green, yellow, red), budget summary with burn rate, upcoming deliverables and dates, and a curated issues list showing only what the client needs to act on. The goal is confidence and transparency. You want the client to log in, see that the project is healthy, and get on with their day.
The magic happens when you build both from the same data source. Your team works in their detailed view. The client sees the polished summary. No duplicate data entry, no "the dashboard says one thing but the spreadsheet says another" conversations.
What to Include in a Project Status Dashboard
After building dozens of these across different industries, I have found that every effective project status dashboard includes some combination of these seven components.
1. Project Health / RAG Status
The single most important element. A red-amber-green (RAG) indicator that answers the question at a glance: is this project in trouble or not?
🟢 Green  — On track. No significant risks.
🟡 Amber  — Minor issues. Needs attention but recoverable.
🔴 Red    — Off track. Immediate action required.
Some teams add a trend arrow to show whether health is improving or declining. I recommend it — a project that has been amber for three weeks straight tells a different story than one that just turned amber yesterday.
2. Milestone Timeline
A visual timeline showing major milestones, their planned dates, and their actual completion status. This is what stakeholders care about most. Not individual tasks, but whether you are going to hit the dates that matter.
Keep it to 8-12 milestones for most projects. More than that and you are showing tasks, not milestones.
3. Task Completion Percentage
A simple progress bar or percentage showing how much of the planned work is done. Pair this with the timeline to give context — 60% complete means something very different when you are 50% through the timeline versus 80% through it.
4. Budget Tracking
For any project with a budget (which is most of them), show total budget versus amount spent, current burn rate, projected final cost, and variance from the original estimate. For client-facing dashboards, this is non-negotiable. Clients will ask about budget whether you show it proactively or not. Better to get ahead of it.
5. Risk and Issues Log
A short list of active risks and open issues, each with a severity rating and an owner. For internal dashboards, include everything. For client-facing dashboards, only surface items that need the client's attention or decision.
6. Team Workload
An internal-only view showing who is overloaded and who has capacity. This is critical for resource planning but should never be shown to clients (it just creates anxiety and micromanagement).
7. Next Actions
What is happening next? What decisions are needed? What are the upcoming deadlines? This section turns a passive dashboard into an active communication tool. Every time someone looks at the dashboard, they should walk away knowing what to do next.
5 Project Status Dashboard Examples
Here are five layouts for different use cases. Each shows the structure and components that work best for that context.
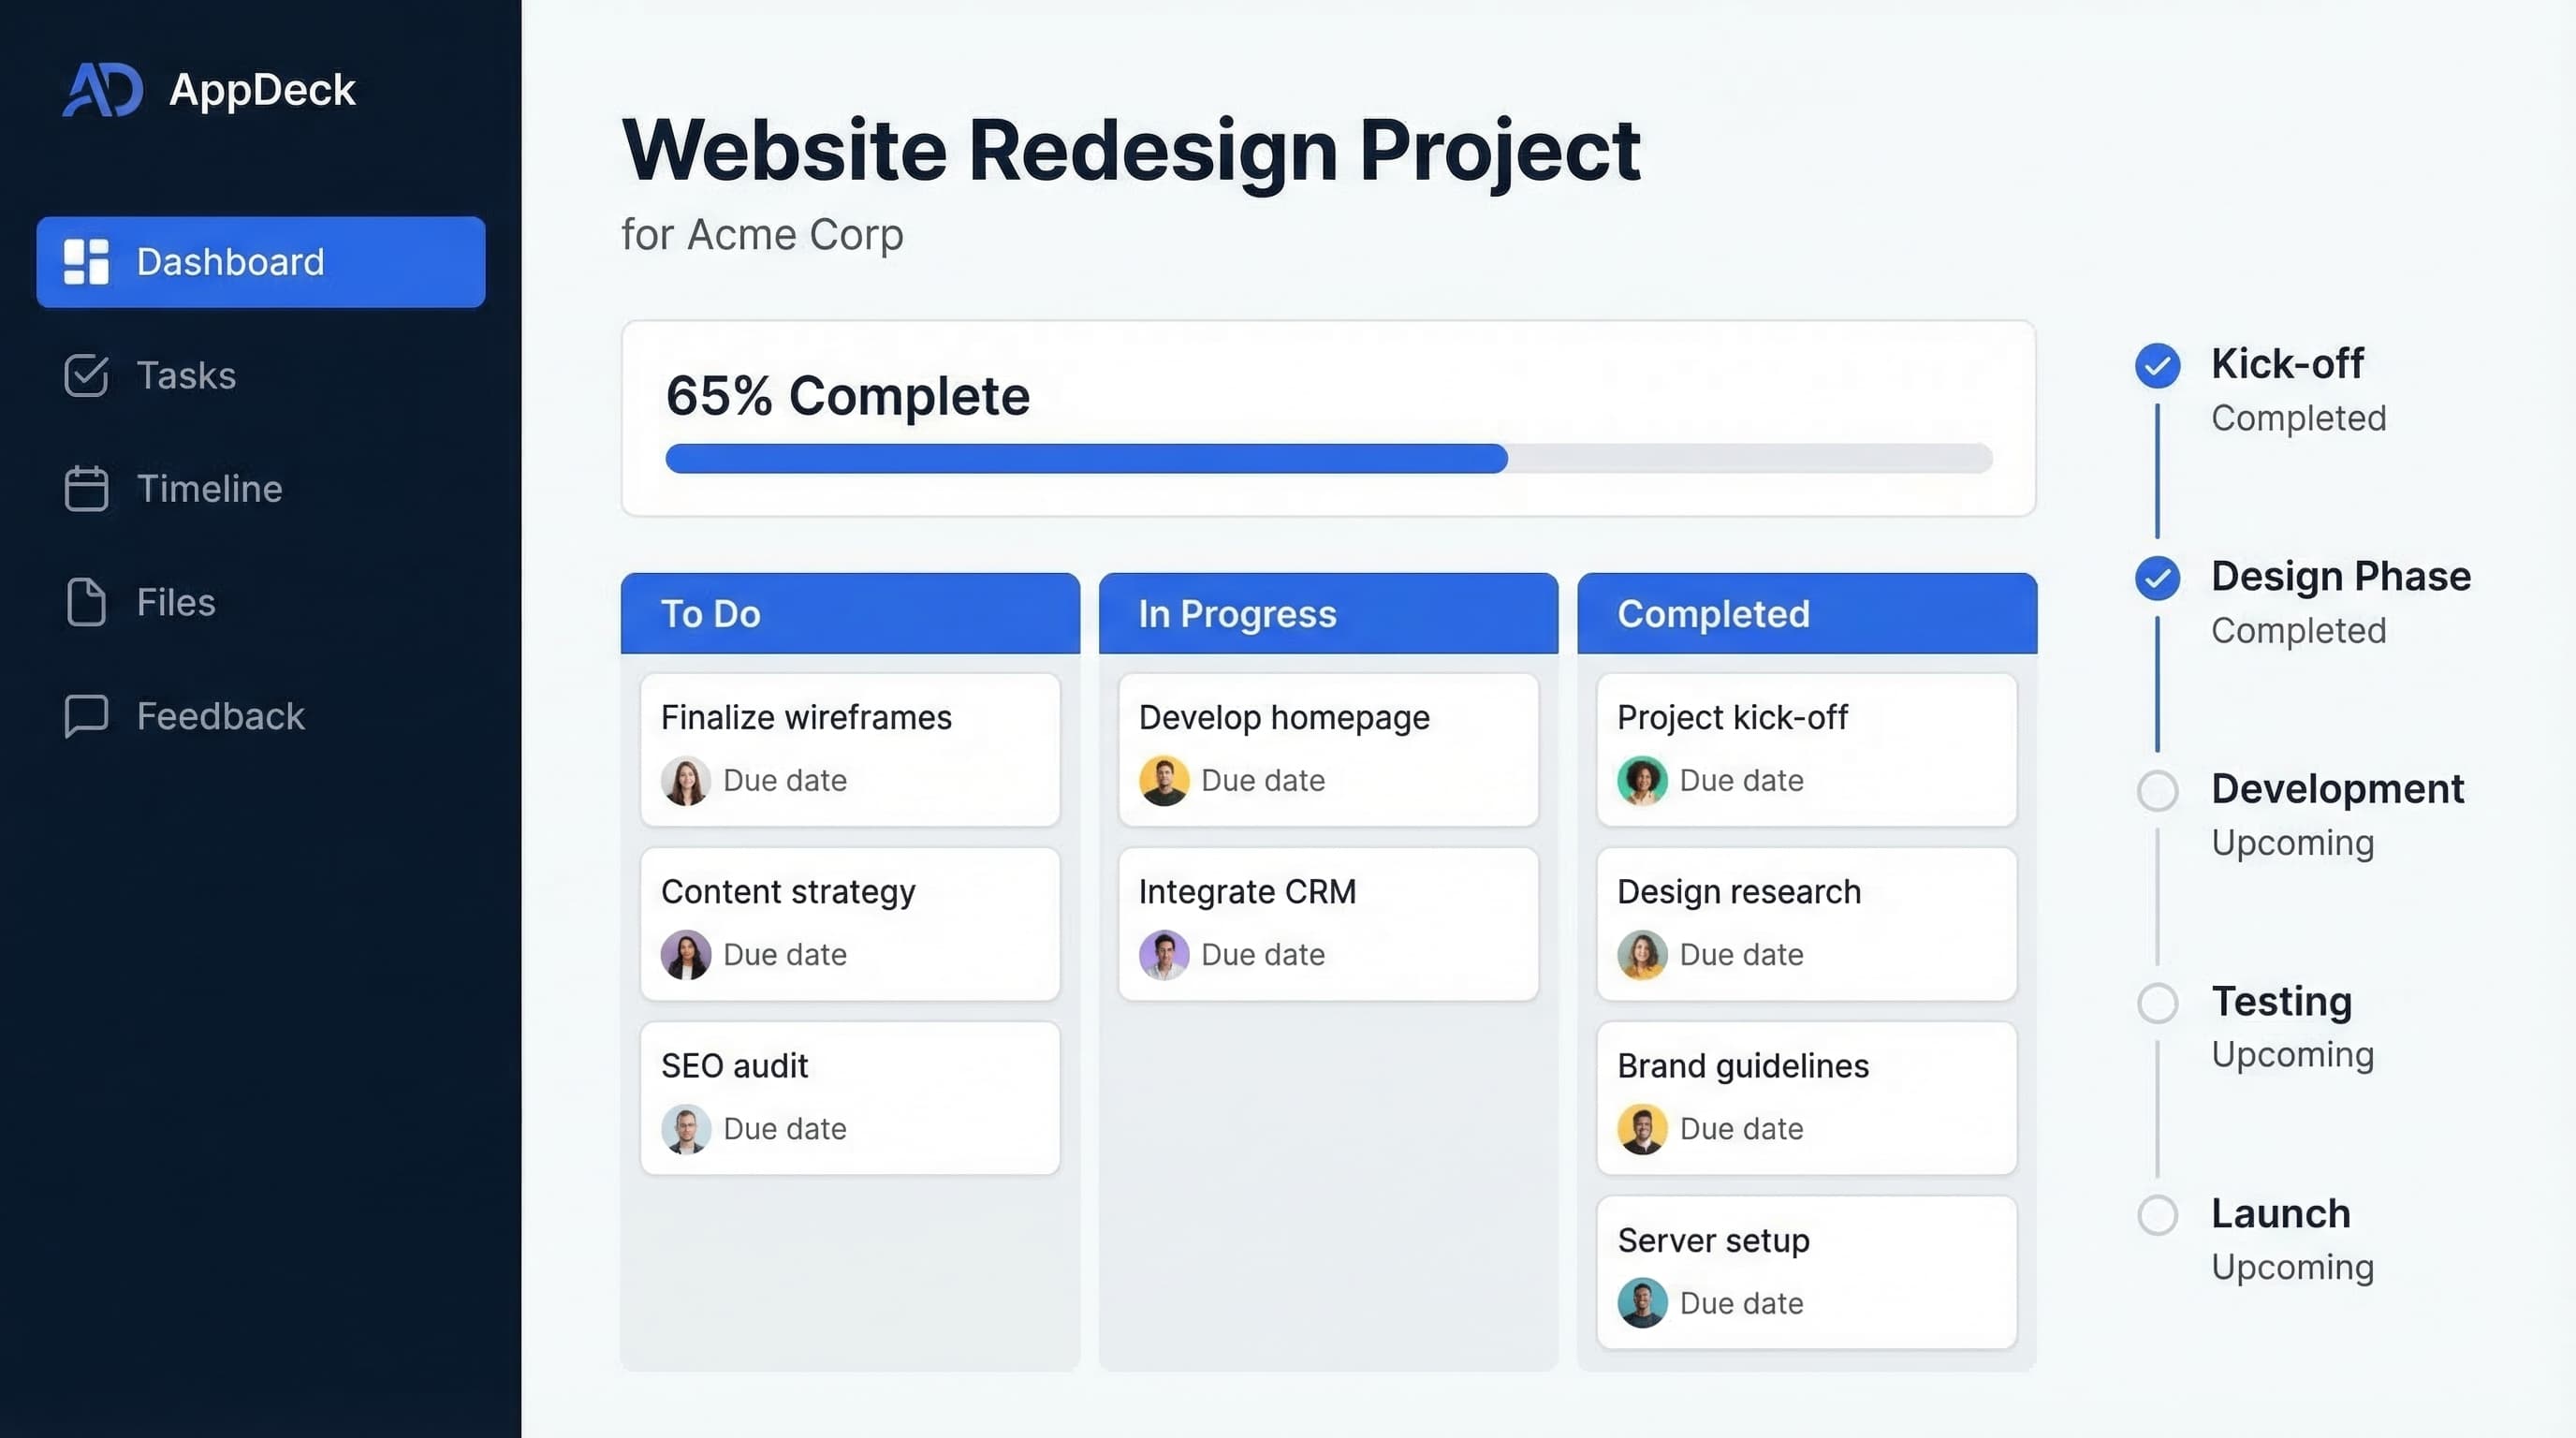
1. Agency Project Dashboard (Client-Facing)
Clean and progress-focused. Designed for clients who want confidence without clutter.
━━━━━━━━━━━━━━━━━━━━━━━━━━━━━━━━━━━━━━━━━━━━━━━━━━━━━━━
   PROJECT: Website Redesign — Acme Corp
   Status: 🟢 On Track    PM: Sarah Chen
━━━━━━━━━━━━━━━━━━━━━━━━━━━━━━━━━━━━━━━━━━━━━━━━━━━━━━━

   OVERALL PROGRESS
   ████████████████████░░░░░░░  72% Complete
   Sprint 6 of 8  |  Est. Completion: May 15

━━━━━━━━━━━━━━━━━━━━━━━━━━━━━━━━━━━━━━━━━━━━━━━━━━━━━━━
   MILESTONES             BUDGET SUMMARY

   ✅ Discovery           Budget:    $120,000
   ✅ Wireframes          Spent:      $82,400
   ✅ Visual Design       Remaining:  $37,600
   🔄 Development         Burn Rate:  $8,200/wk
   ⬜ QA & Testing        Projected:  $118,600
   ⬜ Launch              Variance:   -$1,400 ✅

━━━━━━━━━━━━━━━━━━━━━━━━━━━━━━━━━━━━━━━━━━━━━━━━━━━━━━━
   UPCOMING DELIVERABLES

   Mar 28  — Homepage & landing pages (dev complete)
   Apr 04  — Blog templates & CMS integration
   Apr 11  — Client review period begins

━━━━━━━━━━━━━━━━━━━━━━━━━━━━━━━━━━━━━━━━━━━━━━━━━━━━━━━
   NEEDS YOUR ATTENTION

   ⚠️  Final product photography needed by Apr 01
   ⚠️  Legal review of terms page — awaiting approval

━━━━━━━━━━━━━━━━━━━━━━━━━━━━━━━━━━━━━━━━━━━━━━━━━━━━━━━
2. Software Development Sprint Dashboard (Internal)
Built for engineering teams. Focuses on velocity, burndown, and blockers.
━━━━━━━━━━━━━━━━━━━━━━━━━━━━━━━━━━━━━━━━━━━━━━━━━━━━━━━
   SPRINT 14: User Authentication Overhaul
   Status: 🟡 At Risk     Days Left: 4
━━━━━━━━━━━━━━━━━━━━━━━━━━━━━━━━━━━━━━━━━━━━━━━━━━━━━━━
   BURNDOWN               VELOCITY

   Planned: 42 pts        Sprint 12:  38 pts
   Done:    28 pts        Sprint 13:  41 pts
   In QA:    8 pts        Sprint 14:  28 pts (so far)
   To Do:    6 pts        Avg:        36 pts

━━━━━━━━━━━━━━━━━━━━━━━━━━━━━━━━━━━━━━━━━━━━━━━━━━━━━━━
   TASK BREAKDOWN         CODE QUALITY

   Done:      14          PRs Open:         6
   In Review:  4          Avg Review Time:  4.2 hrs
   In Progress: 5         Test Coverage:    84%
   Blocked:    2          Open Bugs:        3 (1 P1)
   To Do:      3          Tech Debt Items:  7

━━━━━━━━━━━━━━━━━━━━━━━━━━━━━━━━━━━━━━━━━━━━━━━━━━━━━━━
   BLOCKERS

   🔴 AUTH-247: SSO integration waiting on IdP config
      Owner: Mike  |  Blocked 2 days  |  Escalated
   🔴 AUTH-251: OAuth token refresh — needs arch input
      Owner: Priya  |  Blocked 1 day

━━━━━━━━━━━━━━━━━━━━━━━━━━━━━━━━━━━━━━━━━━━━━━━━━━━━━━━
   TEAM WORKLOAD (Story Points)
   Mike:   ████████░░  8 pts   (1 blocked)
   Priya:  ██████████  10 pts  (1 blocked)
   Alex:   ██████░░░░  6 pts
   Jordan: ████████████ 12 pts  ⚠️ Over capacity
   Sam:    ████░░░░░░  4 pts
━━━━━━━━━━━━━━━━━━━━━━━━━━━━━━━━━━━━━━━━━━━━━━━━━━━━━━━
3. Multi-Project Portfolio Dashboard (PMO View)
For program managers and PMOs who need to see all projects at a glance.
━━━━━━━━━━━━━━━━━━━━━━━━━━━━━━━━━━━━━━━━━━━━━━━━━━━━━━━
   PORTFOLIO OVERVIEW — Q1 2026
   Active Projects: 8  |  Total Budget: $2.1M
━━━━━━━━━━━━━━━━━━━━━━━━━━━━━━━━━━━━━━━━━━━━━━━━━━━━━━━
   PROJECT    STATUS   PROG.    BUDGET     DEADLINE
━━━━━━━━━━━━━━━━━━━━━━━━━━━━━━━━━━━━━━━━━━━━━━━━━━━━━━━
   Alpha       🟢       92%     On Track    Mar 30
   Beta        🟢       78%     On Track    Apr 15
   Gamma       🟡       45%     +12%        May 01
   Delta       🟢       67%     On Track    Apr 22
   Epsilon     🔴       31%     +28%        Jun 15
   Zeta        🟢       55%     -3%         May 10
   Eta         🟡       20%     On Track    Jul 01
   Theta       🟢       88%     -5%         Mar 28
━━━━━━━━━━━━━━━━━━━━━━━━━━━━━━━━━━━━━━━━━━━━━━━━━━━━━━━
   PORTFOLIO HEALTH

   🟢 On Track:  5 (62%)
   🟡 At Risk:   2 (25%)
   🔴 Off Track: 1 (13%)

   RESOURCE UTILIZATION
   Engineering:  94%  ⚠️  Near capacity
   Design:       78%
   QA:           65%

   ESCALATIONS
   Epsilon — Scope creep + vendor delay. Exec review
             scheduled for Mar 26.
   Gamma   — Key developer on leave. Backfill needed.
━━━━━━━━━━━━━━━━━━━━━━━━━━━━━━━━━━━━━━━━━━━━━━━━━━━━━━━
4. Construction / Physical Project Dashboard
Milestones, permits, budget, and safety metrics for physical builds.
━━━━━━━━━━━━━━━━━━━━━━━━━━━━━━━━━━━━━━━━━━━━━━━━━━━━━━━
   PROJECT: Downtown Office Renovation — Phase 2
   Status: 🟡 At Risk    Days on Site: 47 of 90
━━━━━━━━━━━━━━━━━━━━━━━━━━━━━━━━━━━━━━━━━━━━━━━━━━━━━━━
   PHASE PROGRESS         BUDGET

   Demolition    ✅       Contract:   $3,200,000
   Structural    ✅       Committed:  $2,840,000
   Mechanical    🔄 80%   Invoiced:   $1,920,000
   Electrical    🔄 65%   Change Ords:  $145,000
   Finishes      ⬜ 0%    Contingency:  $160,000
   Inspections   ⬜ 0%    Projected:  $3,310,000
                          Variance:   +$110,000 ⚠️
━━━━━━━━━━━━━━━━━━━━━━━━━━━━━━━━━━━━━━━━━━━━━━━━━━━━━━━
   PERMITS & APPROVALS    SAFETY

   ✅ Building Permit     Days w/o Incident: 22
   ✅ Fire Safety         Near Misses (MTD):  1
   🔄 Electrical (ETA    Open Safety Items:  2
      Mar 28)             Inspections Passed: 6/6
   ⬜ Final Occupancy

━━━━━━━━━━━━━━━━━━━━━━━━━━━━━━━━━━━━━━━━━━━━━━━━━━━━━━━
   WEATHER & SCHEDULE IMPACT

   3 rain days lost in March. Mechanical work pushed
   by 5 days. Electrician crew doubled to recover.
   Current forecast: 2 days behind. Recoverable.

━━━━━━━━━━━━━━━━━━━━━━━━━━━━━━━━━━━━━━━━━━━━━━━━━━━━━━━
   CRITICAL PATH
   Electrical rough-in ➜ Inspection ➜ Drywall close
   Must complete electrical by Apr 05 or finish date
   slips. Crew working extended hours.
━━━━━━━━━━━━━━━━━━━━━━━━━━━━━━━━━━━━━━━━━━━━━━━━━━━━━━━
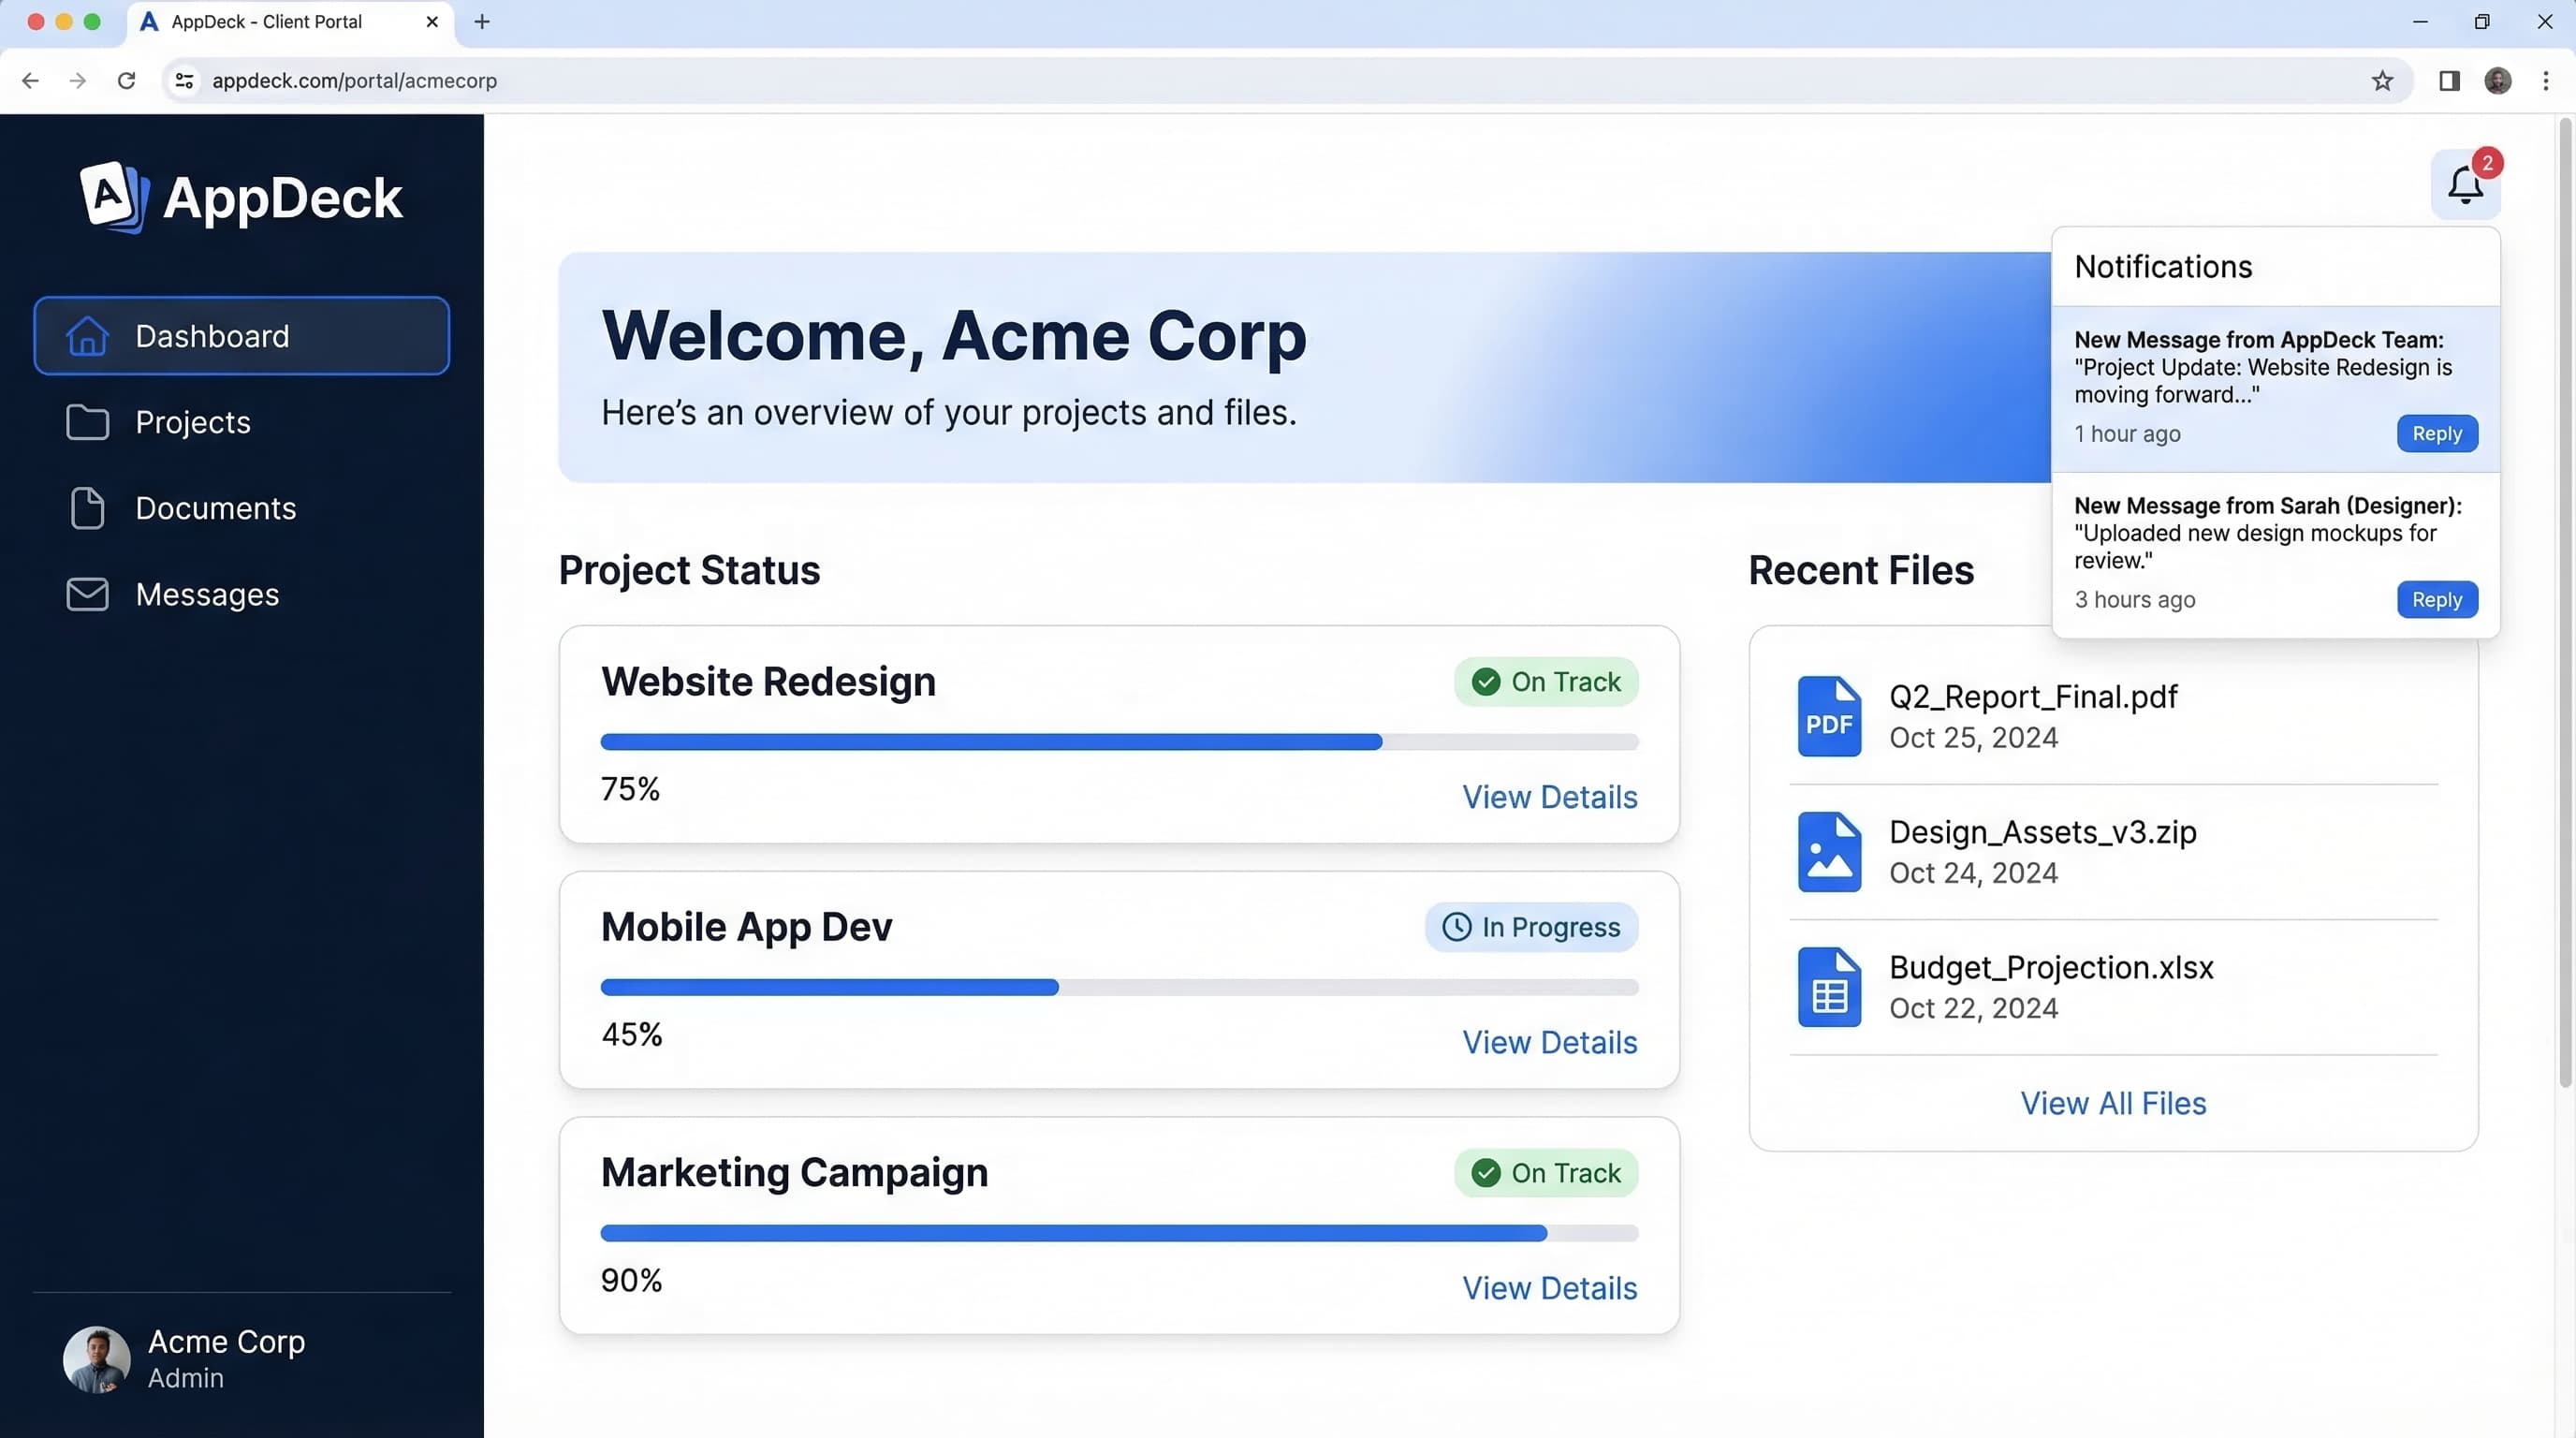
5. Client-Facing Project Portal Dashboard
A branded, self-service dashboard that lives inside a client portal. Auto-updates so the client can check progress anytime without emailing you.
━━━━━━━━━━━━━━━━━━━━━━━━━━━━━━━━━━━━━━━━━━━━━━━━━━━━━━━
   ━━━━━━━━
     LOGO    Acme Corp — Project Portal
   ━━━━━━━━  Welcome back, Jennifer
━━━━━━━━━━━━━━━━━━━━━━━━━━━━━━━━━━━━━━━━━━━━━━━━━━━━━━━

   YOUR PROJECTS
   ━━━━━━━━━━━━━━━━━━━━━━━━━━━━━━━━━━━━━━━━━━━━━━━
      Website Redesign           🟢 On Track
      ████████████████████░░░░░  72%
      Next milestone: Dev Review — Mar 28
   ━━━━━━━━━━━━━━━━━━━━━━━━━━━━━━━━━━━━━━━━━━━━━━━
   ━━━━━━━━━━━━━━━━━━━━━━━━━━━━━━━━━━━━━━━━━━━━━━━
      Mobile App MVP             🟡 At Risk
      ████████████░░░░░░░░░░░░░  45%
      Next milestone: Beta Build — Apr 10
   ━━━━━━━━━━━━━━━━━━━━━━━━━━━━━━━━━━━━━━━━━━━━━━━

━━━━━━━━━━━━━━━━━━━━━━━━━━━━━━━━━━━━━━━━━━━━━━━━━━━━━━━
   RECENT ACTIVITY        ACTION ITEMS

   Mar 23 — Homepage      📋 Review homepage design
     design uploaded         Due: Mar 26
   Mar 22 — Sprint        📋 Approve final copy
     review notes            Due: Mar 28
   Mar 20 — Invoice       📋 Provide product photos
     #1204 posted            Due: Apr 01

━━━━━━━━━━━━━━━━━━━━━━━━━━━━━━━━━━━━━━━━━━━━━━━━━━━━━━━
   DOCUMENTS & DELIVERABLES

   📁 Contracts    📁 Designs    📁 Invoices
   📁 Reports      📁 Assets     📁 Meeting Notes

   [View All Documents →]
━━━━━━━━━━━━━━━━━━━━━━━━━━━━━━━━━━━━━━━━━━━━━━━━━━━━━━━
This last example is where a dedicated project portal platform like AppDeck really shines. Instead of building a custom dashboard from scratch, you get a branded portal with auto-updating project views, document sharing, and client self-service built in.
Key Project Metrics and Formulas
Not every dashboard needs every metric. Pick the ones that match your project type and stakeholder needs.
| Metric | Formula | Good For |
|---|---|---|
| Percent Complete | (Completed Tasks / Total Tasks) x 100 | All projects |
| Schedule Performance Index (SPI) | Earned Value / Planned Value | Earned value projects |
| Cost Performance Index (CPI) | Earned Value / Actual Cost | Budget-tracked projects |
| Schedule Variance | Earned Value - Planned Value | Detecting timeline drift |
| Cost Variance | Earned Value - Actual Cost | Detecting budget drift |
| Burn Rate | Total Spent / Weeks Elapsed | Budgeted projects |
| Estimate at Completion (EAC) | Budget at Completion / CPI | Forecasting final cost |
| Sprint Velocity | Story Points Completed per Sprint | Agile teams |
| Cycle Time | Time from Work Started to Done | Process optimization |
| Lead Time | Time from Request to Delivery | Client-facing work |
| Defect Density | Bugs / Feature Count | Software projects |
| On-Time Delivery Rate | (On-Time Deliverables / Total) x 100 | Agencies, contractors |
| Resource Utilization | (Billable Hours / Available Hours) x 100 | Services firms |
| Scope Change Rate | (Change Requests / Original Scope Items) x 100 | Scope creep detection |
| Client Satisfaction (CSAT) | Survey Score (1-5 or NPS) | Client relationships |
| Risk Exposure | Probability x Impact (for each risk) | Risk management |
A quick note on SPI and CPI: if either of these drops below 1.0, you are behind schedule or over budget respectively. An SPI of 0.85 means you are only getting 85 cents of planned work done for every dollar of time spent. These two numbers alone can tell you whether a project is truly healthy or just looks healthy because nobody has done the math yet.
How to Build a Project Status Dashboard: Step by Step
Step 1: Define Your Audience and Their Questions
Before you pick a tool or design a layout, write down who will look at this dashboard and what questions they need answered. This step prevents the most common dashboard mistake — building one view that tries to serve everyone and ends up serving no one.
For an agency managing client projects, you might have three audiences: the delivery team (needs task-level detail), the account manager (needs client health and budget), and the client (needs progress and upcoming actions). That is three different views, not one.
Step 2: Choose Your Data Sources
Map out where the data currently lives. Your task and project data is probably in a PM tool like Jira, Asana, or Monday.com. Time and budget data might be in a separate tool like Harvest or Toggl. Documents live in Google Drive or SharePoint.
The goal is to identify what can be pulled automatically versus what will need manual input. The more automated your data pipeline, the more likely people will actually trust and use the dashboard.
Step 3: Design the Layout
Start with the RAG status indicator at the top. That is the first thing anyone should see. Then add the milestone timeline and progress bar. Below that, place the supporting details: budget, risks, next actions.
Follow the inverted pyramid principle from journalism — the most important information goes at the top. If someone only looks at the dashboard for five seconds, they should still walk away with the key message.
Step 4: Build and Connect
For internal dashboards, most PM tools have built-in dashboard features that are good enough. Jira has dashboards with gadgets. Asana has portfolios and status updates. Monday.com has customizable views.
For client-facing dashboards, you have a few options. You can share a read-only view from your PM tool (limited branding and control), build something custom in a BI tool like Looker or Power BI (powerful but expensive to maintain), or use a purpose-built portal platform like AppDeck's project portal that gives you a branded client-facing dashboard with granular access controls out of the box.
The right choice depends on how many clients or projects you are managing and how much you care about the client experience. If you are running a few internal projects, your PM tool's built-in dashboards are fine. If you are an agency managing 20 client projects and want each client to have their own branded portal with self-service access, you need something purpose-built.
Step 5: Establish a Review Cadence
A dashboard is only useful if the data stays current. Set a weekly rhythm: project leads update their status every Friday afternoon. The dashboard reflects the latest data by Monday morning. Stakeholders check the dashboard before reaching out with questions.
Over time, you should see a direct reduction in status meetings and "just checking in" messages. If you do not, something about the dashboard is not working — either the data is stale, the layout is confusing, or people do not trust it yet.
Best Tools for Project Status Dashboards
There is no shortage of tools that can power a project dashboard. Here are the ones I see teams using most:
Monday.com is great for teams that want flexibility. Its dashboard views are highly customizable, and the interface is intuitive enough for non-technical stakeholders. Best for mixed teams that need both project management and reporting in one tool.
Asana works well for marketing and creative teams. Its portfolio view gives you a multi-project overview, and status updates are built into the workflow. The client-facing options are limited, though.
Jira is the default for software development teams. Its dashboards are powerful but have a learning curve, and showing a Jira board to a non-technical client is usually not a good idea.
Power BI and Looker are the go-to options for custom dashboards that pull from multiple data sources. If you have a data team and need dashboards that combine project data with financial or operational data, these are hard to beat. The tradeoff is setup time and ongoing maintenance.
AppDeck Project Portal is purpose-built for client-facing project dashboards. If your primary need is giving clients and external stakeholders a branded, self-service view of their projects — with document sharing, automated status updates, and granular access controls — this is what I would recommend. It is designed specifically for the use case where you want to share project status without sharing your internal PM tool.
The honest answer is that most teams end up using a combination. Your delivery team works in Jira or Asana. Your client sees a curated view through a portal tool. The dashboard acts as the bridge between the two.
Common Mistakes to Avoid
Before I wrap up, here are the pitfalls I see most often:
Too many metrics. If your dashboard has 30 data points, it is not a dashboard — it is a spreadsheet. Limit yourself to the 7-10 metrics that actually drive decisions.
Manual updates. If someone has to manually update the dashboard every week, it will be stale within a month. Automate as much as possible.
No RAG status. Skipping the overall health indicator forces people to interpret the data themselves. Most stakeholders do not want to analyze a burndown chart. They want to know: are we okay or not?
Same view for everyone. Your engineering team and your client have completely different needs. Giving them the same dashboard means one of them is getting a bad experience.
Set it and forget it. Dashboards need to evolve as projects progress. What matters in the planning phase is different from what matters during execution or close-out. Review and adjust quarterly at minimum.
Frequently Asked Questions
What is a project status dashboard?
A project status dashboard is a single-page visual summary of a project's health, progress, milestones, risks, and key metrics. It typically includes a RAG (Red/Amber/Green) overall status indicator, completion percentage, milestone tracker, budget burn, open risks and issues, and recent activity. The goal is to let any stakeholder — sponsor, client, team lead, executive — understand project state in 30 seconds without reading a written status report. Good dashboards are tailored to the audience: internal team dashboards expose tasks and dependencies, while client-facing dashboards hide noise and surface only decisions and progress.
How is an internal project dashboard different from a client-facing one?
Internal dashboards are built for delivery teams and expose granular detail: subtasks, blockers, time entries, dependencies, capacity, and team-only comments. Client-facing dashboards strip that noise and present a curated view: milestones with status, deliverables awaiting client review, open questions for the client, project phase, and an overall health indicator. The same data feeds both, but the layout and granularity differ. Mixing the two — giving clients access to your full PM tool — usually backfires because clients get overwhelmed by tasks they don't understand and disengage from the very system you wanted them to use.
How often should a project status dashboard be updated?
Update cadence depends on project pace. For active build phases with daily standups, refresh metrics daily — burndown, completed tasks, open blockers. For client-facing dashboards on multi-month engagements, update at least weekly with milestone progress and a narrative status note. RAG status should be reviewed at the same cadence as the project's regular review meeting (weekly for most professional services projects, daily for software sprints). Avoid real-time updates on client dashboards — they create noise and trigger anxious questions about minor task-level changes that don't affect the overall plan.
Who should use a project status dashboard?
Anyone running projects with multiple stakeholders benefits, but the value is highest for four roles: PMs running multiple parallel projects, agency account managers reporting to clients, portfolio managers overseeing 10+ initiatives, and executives sponsoring strategic projects. Solo contributors on a single short project don't need a dashboard — a checklist is enough. The threshold is usually a project longer than 4 weeks with 3+ stakeholders or a project portfolio where leaders need to see across multiple efforts. Below that, the dashboard maintenance cost exceeds the value.
When should we build a custom dashboard instead of using PM tool reports?
Start with your PM tool's built-in reports (Asana, Monday, ClickUp, Jira all have dashboards). Move to a dedicated portal or BI tool when one of these signals appears: (1) you need a branded client-facing view your PM tool can't produce, (2) you need to combine data from multiple PM tools or systems (time tracking, finance, CRM), or (3) your executive team needs portfolio-level rollups your PM tool's reporting can't generate. Most teams never need to leave their PM tool's reporting layer — the dashboard problem is usually a configuration issue, not a tooling gap.
Conclusion
A project status dashboard is not just a nice-to-have reporting tool. When done right, it fundamentally changes how your team communicates about work. Status meetings get shorter or disappear entirely. Clients stop sending "any updates?" emails. Your PM team gets their time back to actually manage projects instead of reporting on them.
Start simple: one project, one audience, seven core components. Get that working and trusted before you scale to multi-project portfolios or complex client portals. The best dashboard is the one people actually look at — and that only happens when the data is reliable, the layout is clear, and the information is genuinely useful.
If you are building client-facing dashboards specifically, take a look at AppDeck's project portal to see how a dedicated portal platform compares to cobbling together spreadsheets and screen shares.
Related Reading

Founder & CEO, AppDeck
Serial entrepreneur with 20+ years building B2B software companies. Former executive managing 2,800+ employees across three continents. Vik reviews all AppDeck content for accuracy and practical relevance.
Share this article
Explore Related Solutions
Related Articles
Client Portal Software for Agencies: Features, Pricing & Comparison (2026)
Compare the best client portal software for agencies. Features, pricing, and real reviews of top platforms to reduce status meetings and improve client communication.
Project Portal Software Comparison 2026: 8 Best Platforms for Client Collaboration
Compare the best project portal software for 2026. Monday.com, Asana, Basecamp, AppDeck, and 4 others. Features, pricing, and real user reviews for client-facing project tracking.
B2B Portal: What It Is, Why You Need One, and How to Choose the Right Platform
Everything you need to know about B2B portals. Types of portals (client, vendor, partner, investor), key features, how to evaluate platforms, and implementation best practices.