
Financial Dashboard Template: 8 Examples for CFOs, Controllers & FP&A
Free financial dashboard templates for P&L, cash flow, budget vs. actuals, revenue forecasting, and board reporting. Layouts, key metrics, and formulas for finance teams.
Download the template: Get the dashboard as a free Excel file — Financial Dashboard Template (.xlsx) — P&L summary, cash flow, runway, AR/AP aging, and key ratios on sample data. No paywall.
I have spent more hours than I would like to admit staring at financial dashboards that told me absolutely nothing useful. Walls of numbers, charts that looked impressive in a board deck but could not answer the one question that actually mattered: "Are we on track?"
After two decades of building and running B2B software companies, I have learned that the best financial dashboard template is not the prettiest one. It is the one that surfaces the right metric at the right moment so you can make a decision instead of requesting another spreadsheet.
This guide walks through eight financial dashboard templates that I have either built myself or adapted from finance leaders I respect. Each one includes an ASCII layout, the key metrics to include, and practical advice on when to use it. Whether you are a CFO preparing for a board meeting, a controller closing the books, or an FP&A analyst building a rolling forecast, there is a template here for you.
What Makes a Great Financial Dashboard
Before diving into the templates, let me share four principles that separate dashboards people actually use from dashboards that collect dust.
1. Answer One Question Per Section
Every section of your dashboard should answer a single, clear question. "How is revenue trending?" is a good question. "What is the overall financial health of the company?" is too broad to be answered by a single chart. Break it down.
2. Lead With the Exception
Your dashboard should make problems impossible to miss. That means conditional formatting, color-coded thresholds, and variance callouts. If everything looks green, your team should be able to move on in seconds. If something is red, they know exactly where to look.
3. Show Context, Not Just Numbers
A revenue figure of $2.4M means nothing without context. Is that above plan? Below last quarter? Growing or shrinking? Every metric needs a comparison point — budget, prior period, forecast, or target.
4. Design for Your Audience
A board financial report should fit on one screen with quarterly trends. An FP&A forecast dashboard might need drill-down capability across multiple dimensions. Know who is reading the dashboard and what decision they need to make.
8 Financial Dashboard Templates
1. P&L Summary Dashboard
The profit and loss dashboard is the foundation of financial reporting. This layout gives your leadership team a month-over-month view of the income statement with variance analysis built in.
Best for: Monthly close reviews, leadership meetings, board prep
Key metrics: Revenue, COGS, gross margin, operating expenses by category, EBITDA, net income
━━━━━━━━━━━━━━━━━━━━━━━━━━━━━━━━━━━━━━━━━━━━━━━━━━━━━━━━━━━━━━━
   P&L SUMMARY DASHBOARD                    Period: Mar 2026
━━━━━━━━━━━━━━━━━━━━━━━━━━━━━━━━━━━━━━━━━━━━━━━━━━━━━━━━━━━━━━━
                  Actual     Budget    Variance   Var %
━━━━━━━━━━━━━━━━━━━━━━━━━━━━━━━━━━━━━━━━━━━━━━━━━━━━━━━━━━━━━━━
  Revenue         $2.4M      $2.2M      +$200K    ✅ +9.1%
  COGS            $720K      $660K      -$60K     ⚠️ -9.1%
  Gross Margin    $1.68M     $1.54M     +$140K    ✅ +9.1%
  Gross %         70.0%      70.0%        —          —
━━━━━━━━━━━━━━━━━━━━━━━━━━━━━━━━━━━━━━━━━━━━━━━━━━━━━━━━━━━━━━━
  Sales & Mktg    $480K      $500K      +$20K     ✅ +4.0%
  R&D             $360K      $350K      -$10K     ⚠️ -2.9%
  G&A             $240K      $250K      +$10K     ✅ +4.0%
  Total OpEx      $1.08M     $1.10M     +$20K     ✅ +1.8%
━━━━━━━━━━━━━━━━━━━━━━━━━━━━━━━━━━━━━━━━━━━━━━━━━━━━━━━━━━━━━━━
  EBITDA          $600K      $440K      +$160K    ✅ +36.4%
  EBITDA %        25.0%      20.0%      +5.0pp
  Net Income      $420K      $300K      +$120K    ✅ +40.0%
━━━━━━━━━━━━━━━━━━━━━━━━━━━━━━━━━━━━━━━━━━━━━━━━━━━━━━━━━━━━━━━
   [12-Month Revenue Trend]     [Margin Trend Line Chart]
━━━━━━━━━━━━━━━━━━━━━━━━━━━━━━━━━━━━━━━━━━━━━━━━━━━━━━━━━━━━━━━
Implementation tips: Include a 12-month trend chart underneath the table so leadership can see the trajectory, not just the snapshot. Add a waterfall chart for months where you need to explain large variances to the board.
2. Cash Flow Dashboard
Cash is oxygen. I have seen profitable companies run out of cash because nobody was watching the timing of inflows and outflows. This dashboard keeps your treasury function honest.
Best for: Weekly finance reviews, startup cash management, treasury oversight
Key metrics: Operating cash flow, investing activities, financing activities, net change, runway, burn rate
━━━━━━━━━━━━━━━━━━━━━━━━━━━━━━━━━━━━━━━━━━━━━━━━━━━━━━━━━━━━━━━
   CASH FLOW DASHBOARD                       As of: Mar 2026
━━━━━━━━━━━━━━━━━━━━━━━━━━━━━━━━━━━━━━━━━━━━━━━━━━━━━━━━━━━━━━━
  Cash Balance           $4.8M         [Trend ▲ over 6 mo]
  Monthly Burn Rate      $320K/mo
  Runway                 15.0 months   ✅
━━━━━━━━━━━━━━━━━━━━━━━━━━━━━━━━━━━━━━━━━━━━━━━━━━━━━━━━━━━━━━━

   CASH FLOW BREAKDOWN (Current Month)
   ━━━━━━━━━━━━━━━━━━━━━━━━━━━━━━━━━━━━━━━━
     Operating Activities       +$180K
       Collections              +$2.1M
       Payroll                  -$1.2M
       Vendors                  -$520K
       Other Operating          -$200K
   ━━━━━━━━━━━━━━━━━━━━━━━━━━━━━━━━━━━━━━━━
     Investing Activities       -$80K
       CapEx                    -$60K
       Software/Licenses        -$20K
   ━━━━━━━━━━━━━━━━━━━━━━━━━━━━━━━━━━━━━━━━
     Financing Activities       +$0
   ━━━━━━━━━━━━━━━━━━━━━━━━━━━━━━━━━━━━━━━━
     Net Change                 +$100K       ✅
   ━━━━━━━━━━━━━━━━━━━━━━━━━━━━━━━━━━━━━━━━

   [13-Week Cash Forecast Bar Chart]
━━━━━━━━━━━━━━━━━━━━━━━━━━━━━━━━━━━━━━━━━━━━━━━━━━━━━━━━━━━━━━━
Implementation tips: The 13-week cash forecast is non-negotiable. Plot projected inflows and outflows week by week so you can see pinch points before they become emergencies. If your runway drops below 6 months, that cell should turn red automatically.
3. Budget vs. Actuals Dashboard
This is the dashboard your department heads should be reviewing every month. It answers the question every controller gets asked: "Are we over or under budget, and why?"
Best for: Monthly departmental reviews, quarterly business reviews, annual planning
Key metrics: Budget by department, actuals, variance, YTD tracking, reforecast
━━━━━━━━━━━━━━━━━━━━━━━━━━━━━━━━━━━━━━━━━━━━━━━━━━━━━━━━━━━━━━━
   BUDGET vs. ACTUALS                     Q1 2026 YTD
━━━━━━━━━━━━━━━━━━━━━━━━━━━━━━━━━━━━━━━━━━━━━━━━━━━━━━━━━━━━━━━
  Department     YTD Act.   YTD Bud.   Variance   Status
━━━━━━━━━━━━━━━━━━━━━━━━━━━━━━━━━━━━━━━━━━━━━━━━━━━━━━━━━━━━━━━
  Sales           $1.32M     $1.40M     +$80K     ✅ Under
  Marketing       $620K      $580K      -$40K     ⚠️ Over
  Engineering     $1.05M     $1.00M     -$50K     ⚠️ Over
  Product         $380K      $400K      +$20K     ✅ Under
  CS/Support      $290K      $300K      +$10K     ✅ Under
  G&A             $710K      $720K      +$10K     ✅ Under
━━━━━━━━━━━━━━━━━━━━━━━━━━━━━━━━━━━━━━━━━━━━━━━━━━━━━━━━━━━━━━━
  TOTAL           $4.37M     $4.40M     +$30K     ✅ Under
━━━━━━━━━━━━━━━━━━━━━━━━━━━━━━━━━━━━━━━━━━━━━━━━━━━━━━━━━━━━━━━
   [Monthly Spend by Dept - Stacked Bar]
   [Variance Waterfall - Largest Variances]
━━━━━━━━━━━━━━━━━━━━━━━━━━━━━━━━━━━━━━━━━━━━━━━━━━━━━━━━━━━━━━━
Implementation tips: Color-code variance thresholds at 5% (yellow) and 10% (red). Include a notes column or linked commentary so department heads can explain variances without scheduling another meeting. Track both month-over-month and YTD to avoid false alarms from timing differences.
4. Revenue Dashboard
For SaaS and subscription businesses, the revenue dashboard is where growth lives. This template separates new, expansion, and churned revenue so you can see the quality of your growth, not just the top line.
Best for: Weekly revenue reviews, sales leadership, investor updates
Key metrics: MRR, ARR, new MRR, expansion MRR, churned MRR, net new MRR, revenue by segment
━━━━━━━━━━━━━━━━━━━━━━━━━━━━━━━━━━━━━━━━━━━━━━━━━━━━━━━━━━━━━━━
   REVENUE DASHBOARD                         Period: Mar 2026
━━━━━━━━━━━━━━━━━━━━━━━━━━━━━━━━━━━━━━━━━━━━━━━━━━━━━━━━━━━━━━━
  MRR                  $420K          ARR: $5.04M
  MoM Growth           +3.2%          ✅
━━━━━━━━━━━━━━━━━━━━━━━━━━━━━━━━━━━━━━━━━━━━━━━━━━━━━━━━━━━━━━━

   MRR MOVEMENT
   ━━━━━━━━━━━━━━━━━━━━━━━━━━━━━━━━━━━━━━
     Beginning MRR            $407K
     + New Business           +$18K
     + Expansion              +$12K
     - Contraction            -$5K
     - Churn                  -$12K
     = Ending MRR             $420K
   ━━━━━━━━━━━━━━━━━━━━━━━━━━━━━━━━━━━━━━

   REVENUE BY SEGMENT             FORECAST vs ACTUAL
   ━━━━━━━━━━━━━━━━━━━━━━━━━      ━━━━━━━━━━━━━━━━━━━━━━━━━━
     Enterprise    $210K            Month    Fcst    Act.
     Mid-Market    $130K            Jan      $400K   $398K
     SMB           $80K             Feb      $408K   $407K
   ━━━━━━━━━━━━━━━━━━━━━━━━━        Mar      $415K   $420K
                                  ━━━━━━━━━━━━━━━━━━━━━━━━━━
━━━━━━━━━━━━━━━━━━━━━━━━━━━━━━━━━━━━━━━━━━━━━━━━━━━━━━━━━━━━━━━
Implementation tips: The MRR movement waterfall is the most important visual on this dashboard. It tells you whether growth is coming from new logos or existing customers, and whether churn is accelerating. Add a cohort retention chart if you have the data — it is the single best predictor of long-term revenue health.
5. Accounts Receivable Dashboard
If revenue is vanity and profit is sanity, then cash collection is reality. This dashboard keeps your AR team focused on what matters: getting paid on time.
Best for: Weekly AR reviews, collections teams, cash flow forecasting
Key metrics: Total AR, AR aging buckets, DSO, collection rate, overdue amount, top overdue accounts
━━━━━━━━━━━━━━━━━━━━━━━━━━━━━━━━━━━━━━━━━━━━━━━━━━━━━━━━━━━━━━━
   ACCOUNTS RECEIVABLE DASHBOARD             As of: Mar 2026
━━━━━━━━━━━━━━━━━━━━━━━━━━━━━━━━━━━━━━━━━━━━━━━━━━━━━━━━━━━━━━━
  Total AR               $1.8M
  DSO (Days Sales Out)   42 days       Target: 35  ⚠️
  Collection Rate        91.2%         Target: 95% ⚠️
  Overdue Amount         $380K (21%)
━━━━━━━━━━━━━━━━━━━━━━━━━━━━━━━━━━━━━━━━━━━━━━━━━━━━━━━━━━━━━━━

   AR AGING BREAKDOWN
   ━━━━━━━━━━━━━━━━━━━━━━━━━━━━━━━━━━━━━━━━━━━━
     Current             $1.42M    ██████████    79%
     1-30 Days Past      $180K     ██            10%
     31-60 Days Past     $110K     █              6%  ⚠️
     61-90 Days Past     $55K      █              3%  ⚠️
     90+ Days Past       $35K      █              2%  🔴
   ━━━━━━━━━━━━━━━━━━━━━━━━━━━━━━━━━━━━━━━━━━━━

   TOP 5 OVERDUE ACCOUNTS
   ━━━━━━━━━━━━━━━━━━━━━━━━━━━━━━━━━━━━━━━━━━━━━
     Acme Corp             $85K      47 days
     GlobalTech Inc        $62K      38 days
     Summit Partners       $51K      65 days
     Nexus Solutions       $44K      33 days
     Vertex Analytics      $38K      91 days
   ━━━━━━━━━━━━━━━━━━━━━━━━━━━━━━━━━━━━━━━━━━━━━
━━━━━━━━━━━━━━━━━━━━━━━━━━━━━━━━━━━━━━━━━━━━━━━━━━━━━━━━━━━━━━━
Implementation tips: Set DSO targets based on your payment terms, not industry averages. If your terms are Net 30, a DSO of 42 means customers are paying late and you need to investigate. The top overdue accounts list should be a living action item for your collections team — assign owners and track follow-up dates.
6. SaaS Unit Economics Dashboard
Unit economics tell you whether your business model actually works. This dashboard is essential for any SaaS company raising capital, planning growth investments, or just trying to figure out which customer segments are worth pursuing.
Best for: Quarterly strategy reviews, board meetings, fundraising prep
Key metrics: CAC, LTV, LTV:CAC ratio, payback period, gross margin, magic number, net dollar retention
━━━━━━━━━━━━━━━━━━━━━━━━━━━━━━━━━━━━━━━━━━━━━━━━━━━━━━━━━━━━━━━
   SAAS UNIT ECONOMICS                       Q1 2026
━━━━━━━━━━━━━━━━━━━━━━━━━━━━━━━━━━━━━━━━━━━━━━━━━━━━━━━━━━━━━━━
  Metric                Current    Prior Q    Benchmark
━━━━━━━━━━━━━━━━━━━━━━━━━━━━━━━━━━━━━━━━━━━━━━━━━━━━━━━━━━━━━━━
  CAC (Blended)          $18.5K     $21.0K    ✅ Improving
  LTV                    $72K       $68K      ✅ Improving
  LTV : CAC              3.9x       3.2x      ✅ Target: 3x+
  CAC Payback (mo)       14         16        ✅ Target: 18-
  Gross Margin           72%        70%       ✅ Target: 70%+
  Net Dollar Retention   112%       108%      ✅ Target: 110+
  Logo Churn (mo)        2.1%       2.4%      ✅ Target: 3%-
  Revenue Churn (mo)     1.5%       1.8%      ✅ Improving
  Magic Number           0.82       0.71      ✅ Target: 0.75+
━━━━━━━━━━━━━━━━━━━━━━━━━━━━━━━━━━━━━━━━━━━━━━━━━━━━━━━━━━━━━━━

   BY SEGMENT             Enterprise     Mid-Mkt     SMB
   ━━━━━━━━━━━━━━━━━━━━━━━━━━━━━━━━━━━━━━━━━━━━━━━━━━━━━━━━
     CAC                  $32K          $16K        $8K
     LTV                  $180K         $54K        $18K
     LTV:CAC              5.6x          3.4x        2.3x
     Payback (mo)         18            12          11
   ━━━━━━━━━━━━━━━━━━━━━━━━━━━━━━━━━━━━━━━━━━━━━━━━━━━━━━━━

   [LTV:CAC Trend - 8 Quarter Line Chart]
━━━━━━━━━━━━━━━━━━━━━━━━━━━━━━━━━━━━━━━━━━━━━━━━━━━━━━━━━━━━━━━
Implementation tips: Segment your unit economics by customer type, channel, and cohort. Blended numbers hide the truth — you might have amazing enterprise economics subsidizing an unprofitable SMB motion. Update this dashboard quarterly since monthly CAC fluctuations are noisy and misleading.
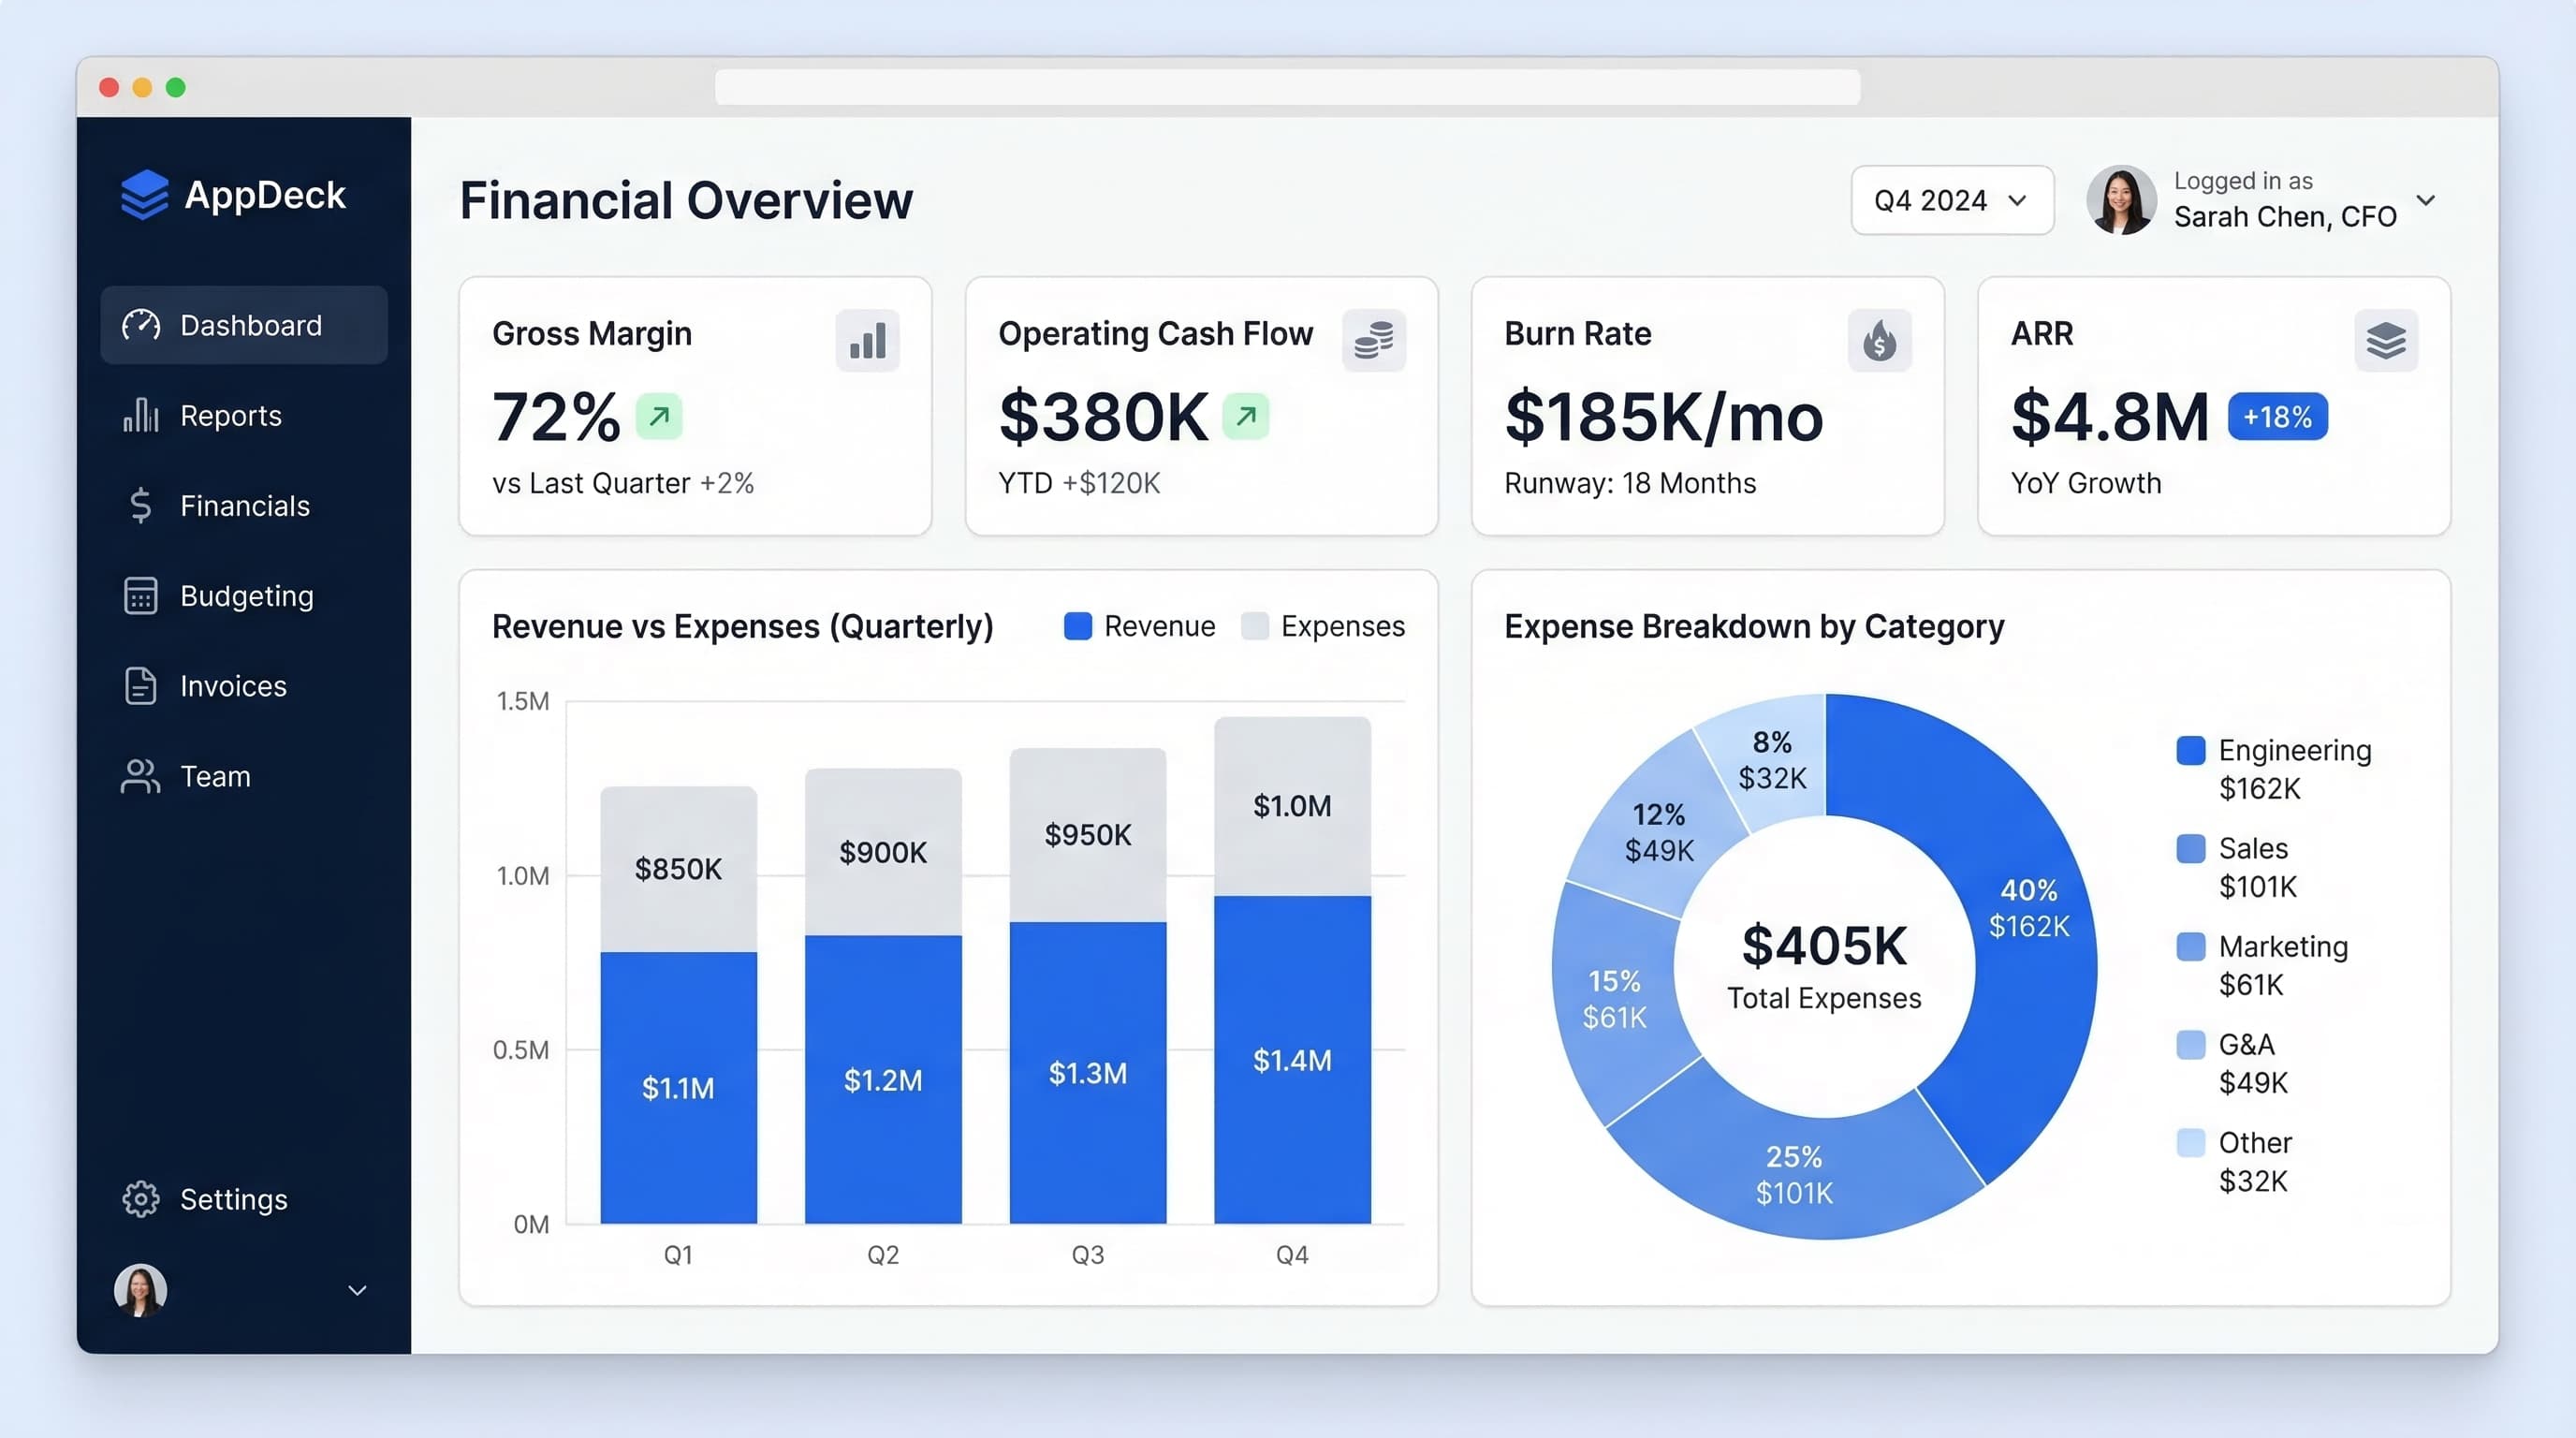
7. Board Financial Report Dashboard
Board members do not want to wade through 30 slides. They want to know: Is the company growing? Is it profitable? How much cash is left? This template gives them exactly that in a single view.
Best for: Board meetings, investor updates, quarterly reporting
Key metrics: ARR, ARR growth, gross margin, EBITDA margin, cash balance, headcount, key milestones
━━━━━━━━━━━━━━━━━━━━━━━━━━━━━━━━━━━━━━━━━━━━━━━━━━━━━━━━━━━━━━━
   BOARD FINANCIAL REPORT                    Q1 2026
━━━━━━━━━━━━━━━━━━━━━━━━━━━━━━━━━━━━━━━━━━━━━━━━━━━━━━━━━━━━━━━

   KEY METRICS
   ━━━━━━━━━━━━━━━━━━━━━━━━━━━━━━━━━━━━━━━━━━━━━━━━━━━━━━━━━━
                     Q1 '26     Q4 '25     Q1 '25    YoY
   ━━━━━━━━━━━━━━━━━━━━━━━━━━━━━━━━━━━━━━━━━━━━━━━━━━━━━━━━━━
     ARR             $5.04M     $4.68M     $3.60M    +40%
     QoQ Growth      +7.7%      +8.1%      +6.5%
     Gross Margin    72%        70%        68%       +4pp
     EBITDA Margin   25%        20%        12%       +13pp
     Cash Balance    $4.8M      $4.5M      $5.2M
     Headcount       68         62         48        +42%
     NRR             112%       108%       105%      +7pp
   ━━━━━━━━━━━━━━━━━━━━━━━━━━━━━━━━━━━━━━━━━━━━━━━━━━━━━━━━━━

   [ARR Waterfall: Beginning + New + Expansion - Churn = End]

   [Cash Bridge: Beginning +/- Operating +/- CapEx = End]

   MILESTONES
   ✅ Closed 3 enterprise deals ($180K+ ACV)
   ✅ Gross margin crossed 70% for first time
   ⚠️ Engineering headcount 2 behind plan
━━━━━━━━━━━━━━━━━━━━━━━━━━━━━━━━━━━━━━━━━━━━━━━━━━━━━━━━━━━━━━━
Implementation tips: The board report should never require scrolling. If it does not fit on one screen, you are including too much detail. Lead with the ARR waterfall because it tells the full growth story in one chart. Add a short milestones section at the bottom — boards care about narrative as much as numbers.
8. FP&A Forecast Dashboard
Forecasting is where finance goes from record-keeping to decision-making. This dashboard compares your forecast to actuals, supports scenario modeling, and maintains a rolling 12-month forward view.
Best for: Weekly FP&A reviews, scenario planning, reforecasting cycles
Key metrics: Forecast vs actual, variance, rolling 12-month forecast, scenarios (base/bull/bear)
━━━━━━━━━━━━━━━━━━━━━━━━━━━━━━━━━━━━━━━━━━━━━━━━━━━━━━━━━━━━━━━
   FP&A FORECAST DASHBOARD                   Mar 2026
━━━━━━━━━━━━━━━━━━━━━━━━━━━━━━━━━━━━━━━━━━━━━━━━━━━━━━━━━━━━━━━

   FORECAST vs ACTUAL (YTD)
   ━━━━━━━━━━━━━━━━━━━━━━━━━━━━━━━━━━━━━━━━━━━━━━━━━━━━━━━━━━
     Month      Forecast   Actual     Var $      Var %
   ━━━━━━━━━━━━━━━━━━━━━━━━━━━━━━━━━━━━━━━━━━━━━━━━━━━━━━━━━━
     Jan         $2.20M     $2.18M     -$20K     -0.9%
     Feb         $2.28M     $2.32M     +$40K     +1.8%
     Mar         $2.35M     $2.40M     +$50K     +2.1%
     YTD         $6.83M     $6.90M     +$70K     ✅ +1.0%
   ━━━━━━━━━━━━━━━━━━━━━━━━━━━━━━━━━━━━━━━━━━━━━━━━━━━━━━━━━━

   SCENARIO ANALYSIS (Full Year 2026)
   ━━━━━━━━━━━━━━━━━━━━━━━━━━━━━━━━━━━━━━━━━━━━━━━━━
                     Bear       Base       Bull
   ━━━━━━━━━━━━━━━━━━━━━━━━━━━━━━━━━━━━━━━━━━━━━━━━━
     Revenue         $26M       $30M       $34M
     EBITDA          $3.1M      $5.4M      $7.8M
     EBITDA %        12%        18%        23%
     Year-End Cash   $3.2M      $5.0M      $6.8M
     Headcount       72         82         90
   ━━━━━━━━━━━━━━━━━━━━━━━━━━━━━━━━━━━━━━━━━━━━━━━━━

   [Rolling 12-Month Revenue Forecast Line Chart]
   [Actuals (solid) vs Forecast (dashed) vs Prior Forecast]
━━━━━━━━━━━━━━━━━━━━━━━━━━━━━━━━━━━━━━━━━━━━━━━━━━━━━━━━━━━━━━━
Implementation tips: Maintain at least three scenarios and update them monthly. The most useful part of scenario analysis is not predicting the future — it is knowing in advance what you would do if the bear case starts materializing. Track forecast accuracy over time. If your team consistently misses by more than 5%, your forecasting model needs work.
Key Financial Metrics Reference
Here is a quick reference for the metrics used across these templates. Bookmark this table — it saves time when you are building or customizing your own dashboards.
| Metric | Formula | Target / Benchmark |
|---|---|---|
| Gross Margin % | (Revenue - COGS) / Revenue | 70%+ for SaaS |
| EBITDA Margin | EBITDA / Revenue | 20%+ at scale |
| Net Income Margin | Net Income / Revenue | Varies by stage |
| MRR | Sum of all monthly recurring revenue | Trending up |
| ARR | MRR x 12 | Trending up |
| Net New MRR | New + Expansion - Contraction - Churn | Positive and growing |
| MoM Growth Rate | (Current MRR - Prior MRR) / Prior MRR | 5-10% early stage |
| CAC | Total S&M Spend / New Customers Acquired | Lower is better |
| LTV | ARPU x Gross Margin / Monthly Churn Rate | 3x+ CAC |
| LTV:CAC Ratio | Customer Lifetime Value / CAC | 3:1 to 5:1 |
| CAC Payback Period | CAC / (ARPU x Gross Margin) | Under 18 months |
| Net Dollar Retention | (Beginning MRR + Expansion - Contraction - Churn) / Beginning MRR | 110%+ |
| Logo Churn Rate | Customers Lost / Beginning Customers | Under 3% monthly |
| DSO | (Accounts Receivable / Revenue) x Days in Period | Under 45 days |
| Collection Rate | Cash Collected / Total Invoiced | 95%+ |
| Burn Rate | Net Cash Used per Month | Decreasing over time |
| Runway | Cash Balance / Monthly Burn Rate | 12+ months |
| Magic Number | Net New ARR / Prior Quarter S&M Spend | 0.75+ |
| Rule of 40 | Revenue Growth % + EBITDA Margin % | 40%+ |
| Operating Cash Flow | Cash from Operations (not accrual income) | Positive |
Tools for Building Financial Dashboards
You have plenty of options depending on your team size, budget, and technical comfort level.
Spreadsheets (Excel / Google Sheets)
Still the most common starting point for finance teams. Excel is powerful enough for most small and mid-market companies. The downside: version control is a nightmare, manual data entry leads to errors, and sharing live dashboards requires workarounds.
Best for: Early-stage companies, ad-hoc analysis, one-off board decks
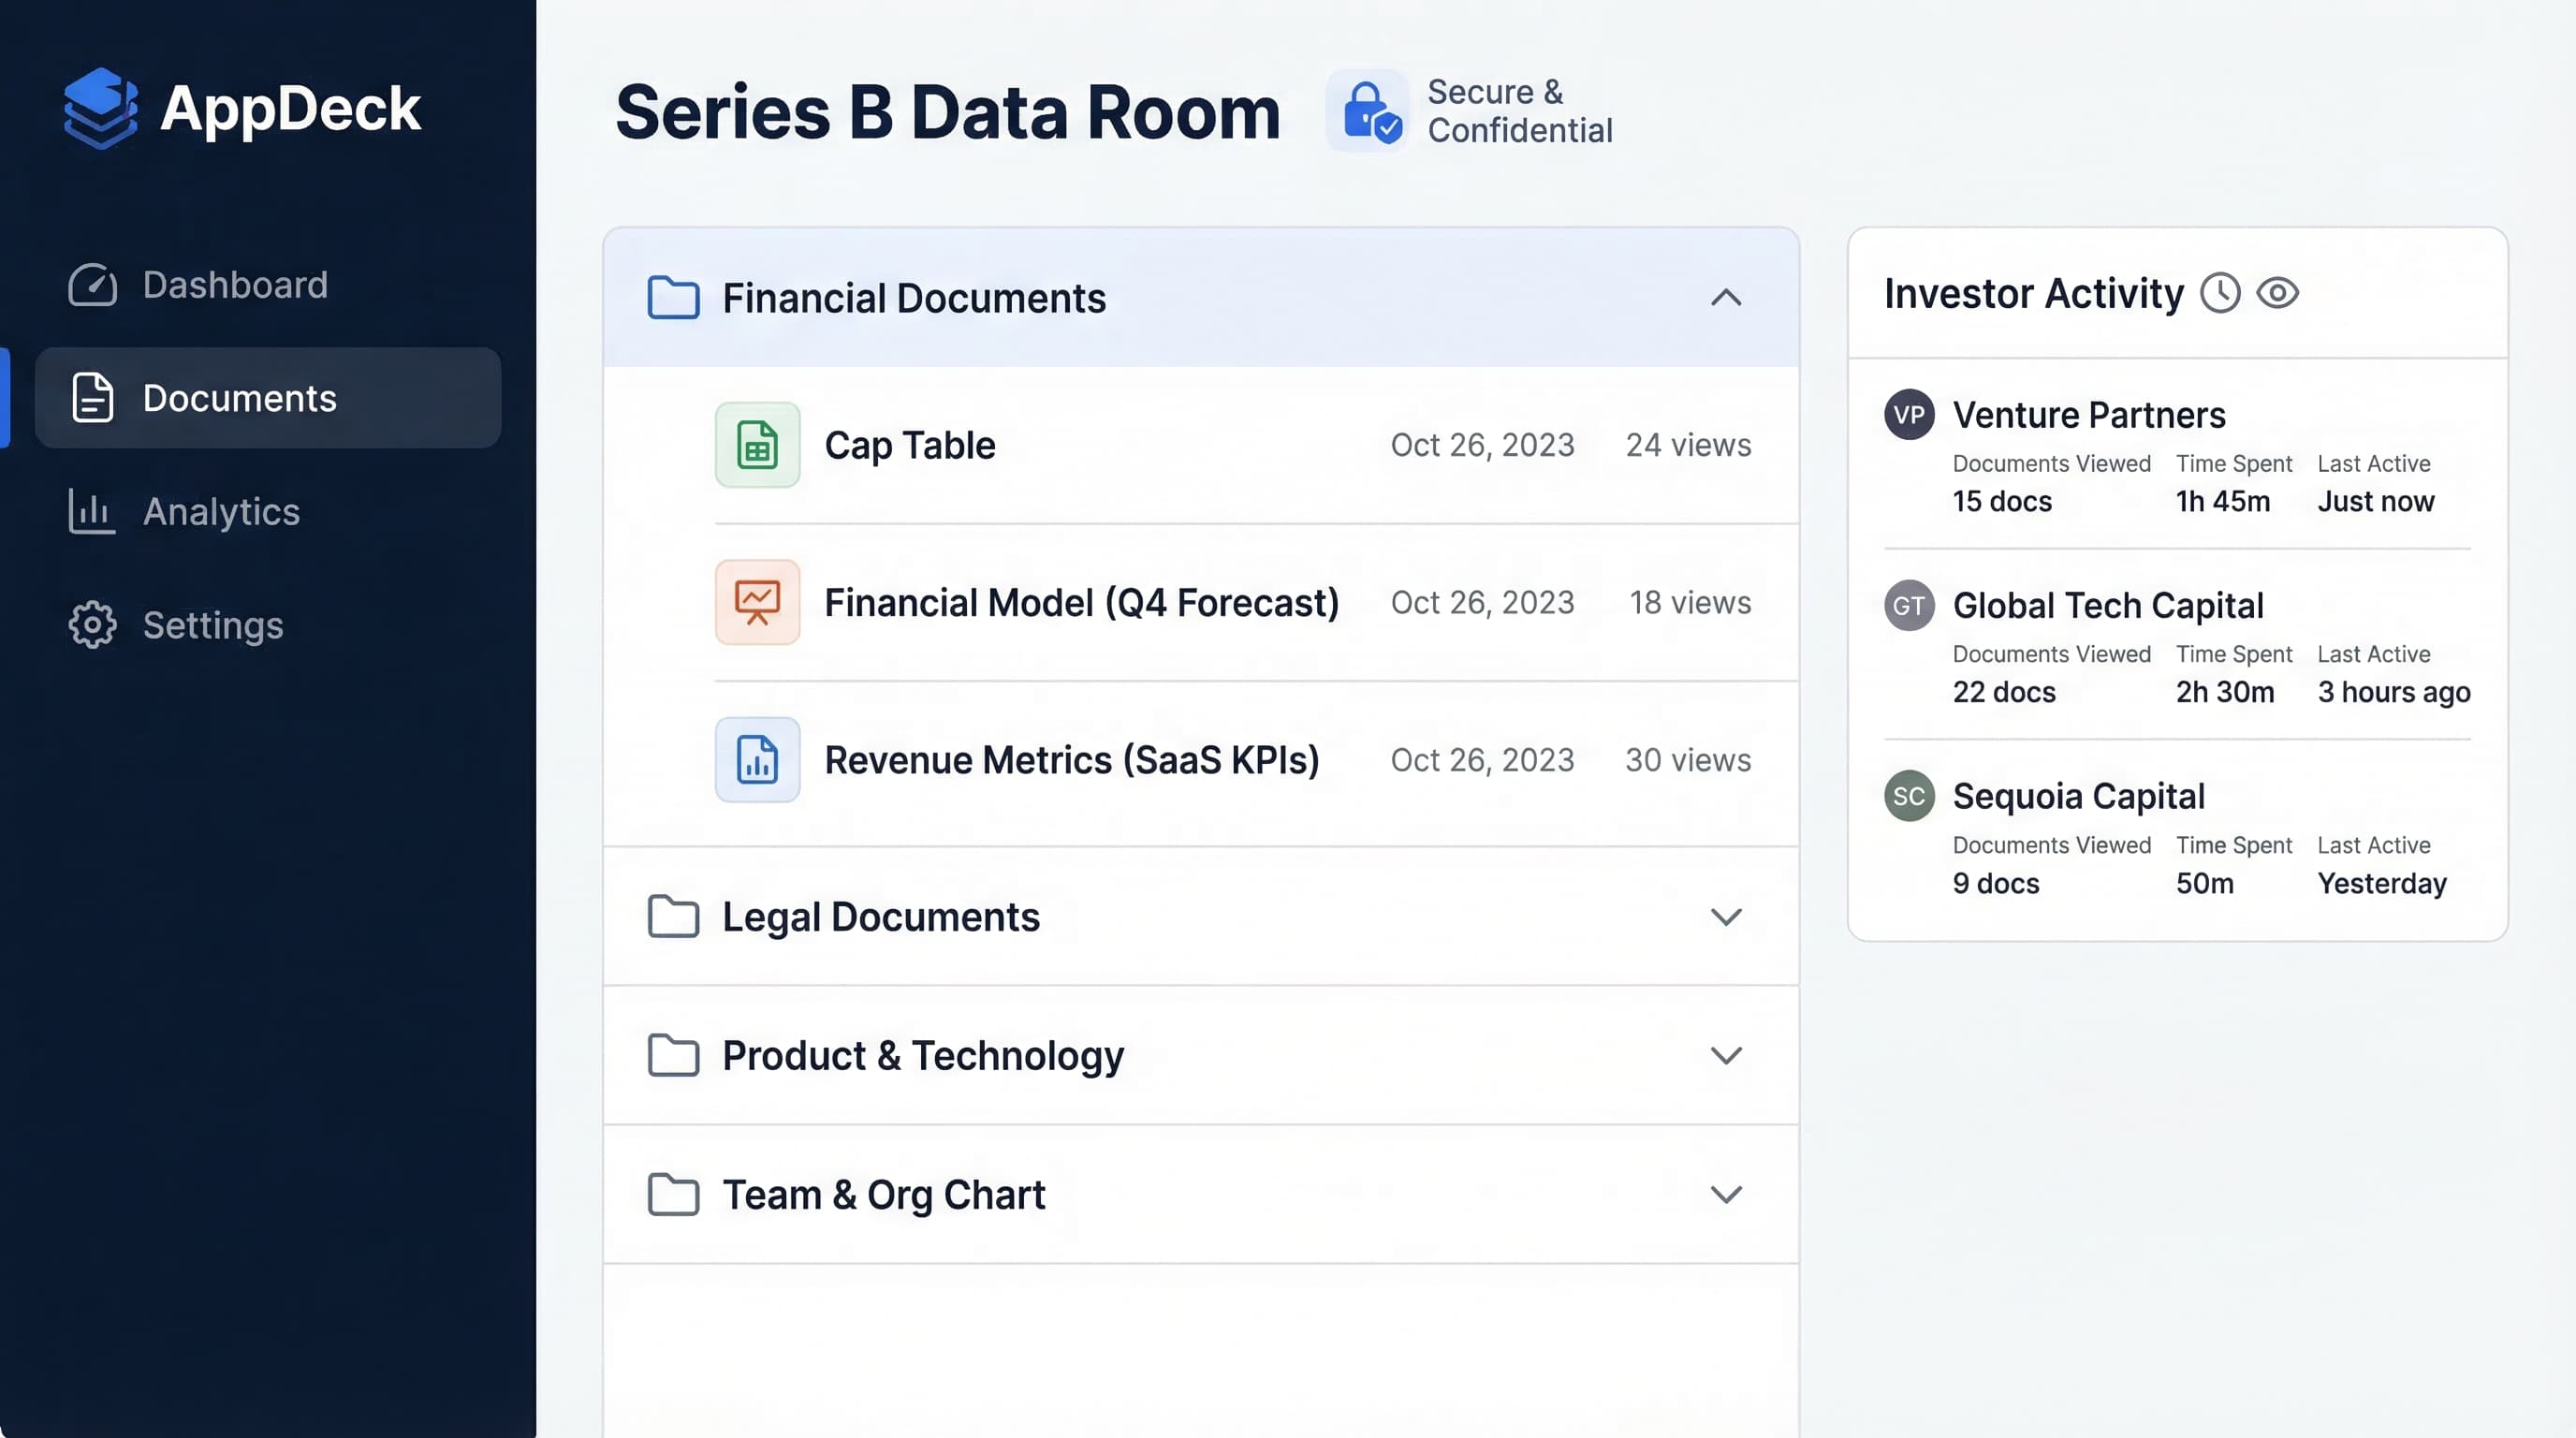
AppDeck Executive Dashboards
If you want a dedicated dashboard portal that your board, investors, and leadership team can access anytime — without sending spreadsheet attachments — AppDeck Executive Dashboards let you build polished, real-time financial dashboards with role-based access controls. You can embed charts from your existing BI tools, add commentary, and keep everything in one secure place.
Best for: Board reporting, investor updates, executive team portals
NetSuite / ERP Dashboards
Enterprise ERPs like NetSuite, Sage Intacct, and SAP have built-in dashboard capabilities. They are powerful but rigid — customization usually requires a consultant, and the UI was not designed for executives who want a quick snapshot.
Best for: Companies already on the ERP with dedicated finance ops resources
Mosaic / Jirav / Cube
Modern FP&A platforms integrate directly with your GL, billing system, and HRIS to automate the data pipeline. They are excellent for rolling forecasts, scenario analysis, and budget vs. actuals — but they come with a price tag that makes sense only at a certain scale.
Best for: FP&A teams at companies with $10M+ in revenue that need automated forecasting
How to Choose the Right Template
Not every company needs all eight dashboards. Here is a practical way to prioritize:
Seed to Series A: Start with the P&L Summary, Cash Flow, and Revenue dashboards. Cash management is everything at this stage.
Series B and beyond: Add the Budget vs. Actuals, SaaS Unit Economics, and Board Financial Report dashboards. Your board and investors will expect this level of rigor.
Public or pre-IPO: You need all eight, plus audit-ready data lineage and SOX-compliant access controls.
The key is to start with the dashboards that answer the questions your stakeholders are already asking. Build those well, earn trust, and expand from there.
Frequently Asked Questions
What is a financial dashboard template and what does it typically include?
A financial dashboard template is a pre-built layout of finance KPIs designed around a specific purpose: P&L summary, cash flow, budget vs. actuals, revenue tracking, accounts receivable, SaaS unit economics, board reporting, or FP&A forecasting. Each template includes the metric definitions, the layout (KPI cards, trend charts, variance tables), and the formulas to calculate variance against budget or prior period. The eight templates in this guide cover the dashboards most finance teams need from seed stage through Series C and beyond. Treat them as starting points to customize, not finished products.
How is a financial dashboard different from a general business dashboard?
A financial dashboard is owned by finance and built on accounting-system data (revenue recognition, GL, AR/AP, cash). A general business dashboard mixes finance with operational metrics (sales pipeline, headcount, product usage, NPS). The data sources are different, the refresh cadence is different (financial data lags by 1-3 days at minimum due to invoice cutoffs and reconciliation), and the audience is different. Finance dashboards must reconcile to the GL; operational dashboards do not. Most companies need both, but they should be built separately and clearly labeled.
How long does it take to build a financial dashboard?
A basic P&L or cash flow dashboard built in Excel or Google Sheets from a template takes 4 to 8 hours. A connected dashboard pulling from QuickBooks, Stripe, and HRIS via a tool like AppDeck or Mosaic takes 1 to 3 days for initial setup plus 1 to 2 weeks of validation against your existing month-end close. A fully automated FP&A platform with rolling forecasts, scenario modeling, and audit-ready data lineage takes 4 to 8 weeks to implement and 2 to 3 months to fully trust. Don't underestimate the validation step—data that doesn't tie to your audited financials destroys credibility.
Who in finance should own each dashboard type?
The CFO owns the board financial report, the cash flow dashboard, and the SaaS unit economics dashboard—these are board-visible and require executive judgment on commentary. The controller owns the P&L summary and accounts receivable dashboard since both tie directly to monthly close. FP&A analysts own the budget vs. actuals dashboard and the forecast dashboard. The revenue accounting lead owns the revenue dashboard, particularly the MRR movement waterfall. Avoid having a single person own all dashboards—it creates a bottleneck and a single point of failure when they're on vacation.
When does a startup or growth-stage company need each of these dashboards?
Seed to Series A companies need the P&L Summary, Cash Flow, and Revenue dashboards. Cash management is everything at this stage. Series B and beyond should add Budget vs. Actuals, SaaS Unit Economics, and Board Financial Report. Your investors will expect this rigor. Public or pre-IPO companies need all eight plus audit-ready data lineage and SOX-compliant access controls. Add the FP&A Forecast dashboard once you have a dedicated FP&A function (typically Series B+). Add the AR dashboard once monthly invoiced revenue exceeds $500K and DSO management becomes material.
Conclusion
A financial dashboard template is just a starting point. The real value comes from tailoring it to your business, keeping the data fresh, and using it to drive decisions — not just report history.
If there is one thing I have learned from building companies across multiple continents and time zones, it is this: the finance team that can deliver a clear, accurate dashboard within 48 hours of month-end close earns a disproportionate amount of trust and influence within the organization. That trust translates into better resource allocation, faster decision-making, and ultimately a healthier business.
Start with one or two of these templates. Get them right. Then expand. Your future self — and your board — will thank you.
Related Reading

Founder & CEO, AppDeck
Serial entrepreneur with 20+ years building B2B software companies. Former executive managing 2,800+ employees across three continents. Vik reviews all AppDeck content for accuracy and practical relevance.
Share this article
Explore Related Solutions
Related Articles
CFO Executive Dashboard: Essential Metrics & Complete Setup Guide (2026)
Complete guide to building a CFO executive dashboard. Essential financial KPIs, board reporting metrics, real-time analytics, dashboard design best practices, and software recommendations.
Investor Update Email Template: 5 Free Templates & Writing Guide
5 free investor update email templates for startups. Monthly, quarterly, fundraising, and board-ready formats with real examples and best practices.
Board Report Template: 6 Free Templates for Effective Board Reporting
Download free board report templates for CEOs, CFOs, and committee chairs. Financial reports, operational updates, and strategic review formats.