
Marketing Dashboard Template
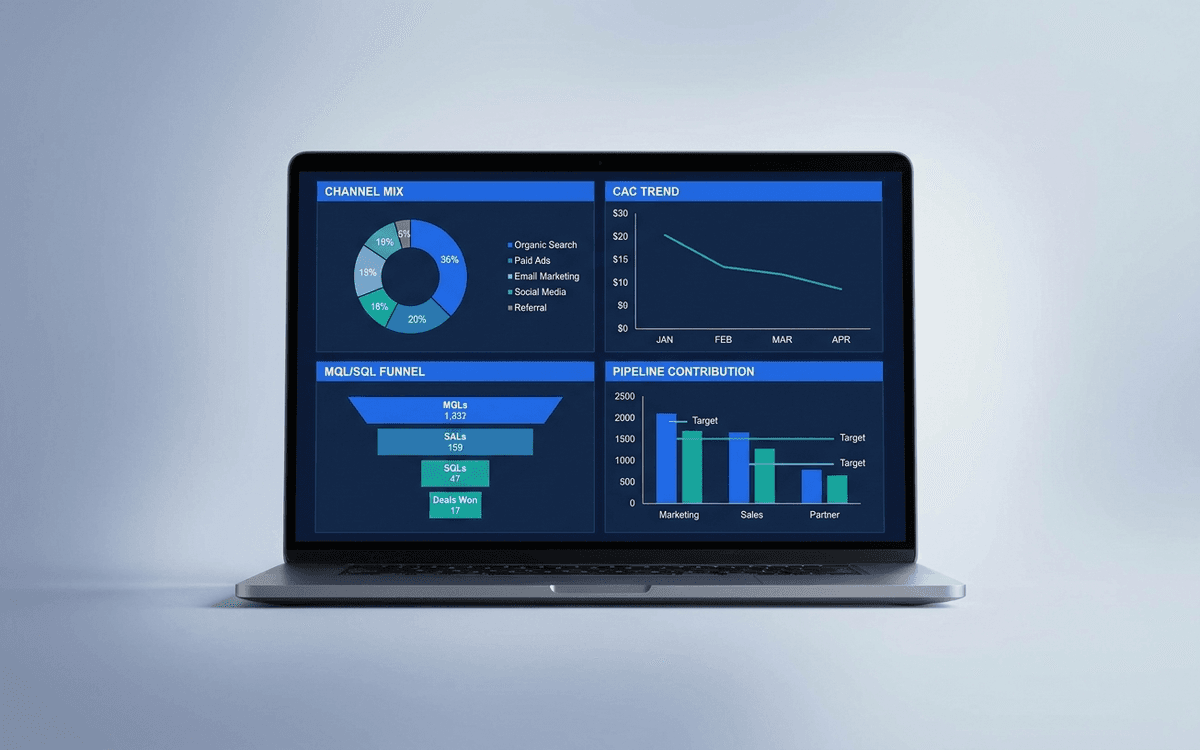
A marketing dashboard template covering the metrics CMOs actually defend — channel mix, blended CAC, MQL/SQL conversion, marketing-sourced pipeline, and ROI per program — in a one-page weekly review that ties spend to outcomes.
Download this template — free
Tell us where to send the link. We'll never share your email.
What's included
- Channel mix view (paid, organic, referral, events)
- Blended and channel-specific CAC
- MQL and SQL volume + conversion rate trend
- Marketing-sourced and marketing-influenced pipeline
- Pipeline contribution by program / campaign
- Cost per MQL, cost per SQL, cost per opportunity
- Brand metrics (organic search volume, direct traffic, branded queries)
- ROI by program (cost vs. closed-won revenue)
- Source data on a separate tab
How to use this template
1. Pick ONE attribution model and stick with it
First-touch, last-touch, multi-touch, time-decay — none is "right." What kills marketing dashboards is switching attribution models mid-period. Pick one, document it, stick with it for at least a full year. Switch only at year boundaries with a clear before/after note.
2. Report BOTH sourced and influenced pipeline
Marketing-sourced pipeline (marketing was the first touch) underweights brand and content. Marketing-influenced (marketing touched the deal at some point) overweights it. Best practice: report both, side by side. The truth is usually somewhere between.
3. Tie CAC to LTV, not to revenue alone
CAC in isolation is meaningless. The dashboard pairs CAC with LTV and shows the LTV:CAC ratio. The target depends on business model — 3:1 for healthy SaaS, higher for marketplaces — but the ratio is what matters, not the absolute CAC.
4. Show ROI per program, not blended ROI
Blended marketing ROI hides the dynamics. The dashboard breaks out ROI per program (paid search by keyword cluster, content by topic, events by event, etc.). That's what gives the CMO ammunition for the budget review — kill the bottom 20% per period.
5. Track brand metrics separately from demand
Brand metrics (direct traffic, branded search, share of voice) move slowly and don't correlate with last-week's campaign. Put them in a separate section on the dashboard so they don't get judged on a weekly cadence. Brand pays off on a 6–12 month lag.
Who it's for
- CMOs reporting to a sales-led leadership team
- Marketing ops leads owning attribution
- Demand-gen leaders running multi-channel programs
- Founders running marketing themselves at early stage
Frequently asked questions
- What attribution model should I use?
- For B2B with a long sales cycle: multi-touch or first-touch typically work best. For B2C / e-commerce with a short cycle: last-touch is usually fine. The bigger mistake is switching models mid-period. Pick one, document it, defend it.
- What's a healthy CAC payback period?
- Common SaaS benchmarks: under 12 months is healthy, 12–18 is acceptable, 18+ is concerning. Marketplaces and freemium models often run longer payback. The target depends on gross margin and retention — high-margin, high-retention businesses can support longer payback.
- How often should we update the marketing dashboard?
- Weekly for the operating view. Some metrics (brand awareness, organic search rank) only move meaningfully on a monthly or quarterly cadence — show those with longer trailing windows. Match the metric cadence to how fast the metric actually moves.
- Should marketing dashboards include pipeline?
- Yes — separate sections for marketing-sourced pipeline and marketing-influenced pipeline. Reporting on MQL volume without showing pipeline impact lets marketing get rewarded for activity rather than outcomes. Pipeline closes that loop.
- What's the difference between an MQL and an SQL?
- MQL (Marketing Qualified Lead): someone marketing thinks is sales-ready based on behavioral and demographic criteria. SQL (Sales Qualified Lead): someone sales has accepted and is actively working. The MQL → SQL conversion rate is one of the most diagnostic metrics on the dashboard — low conversion means marketing's qualification criteria are wrong.
More dashboards templates
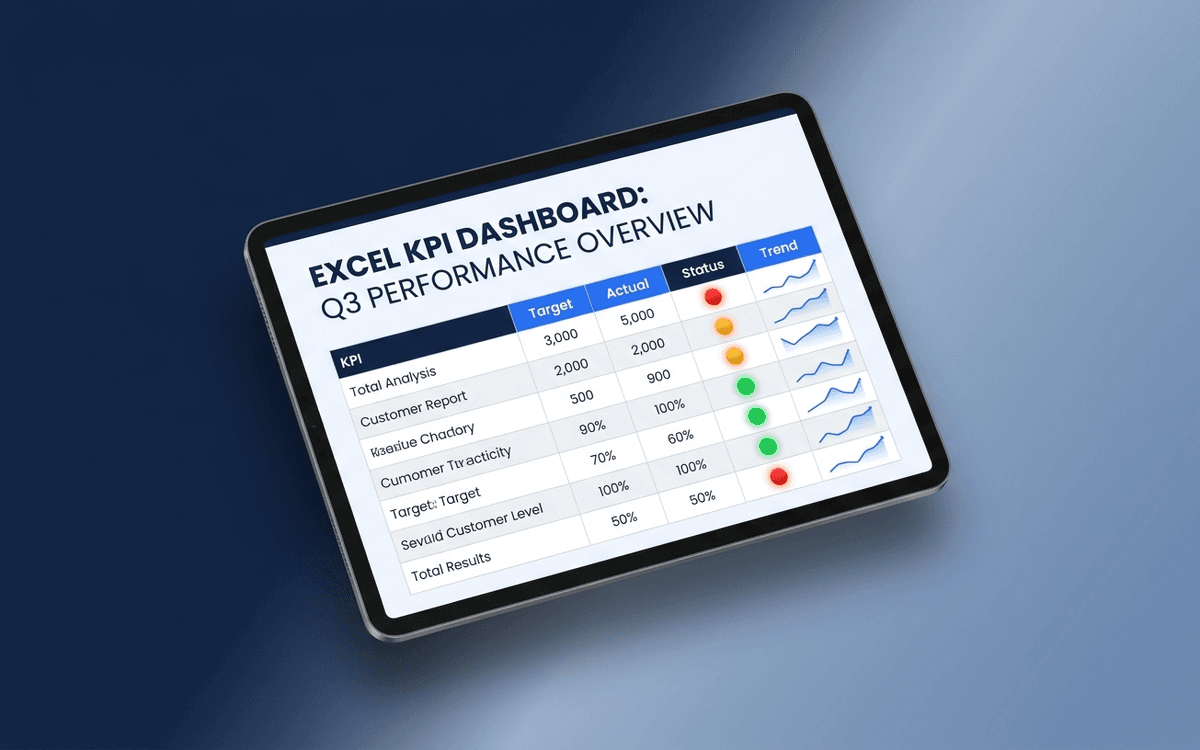
KPI Dashboard Template
A KPI dashboard template that separates leading from lagging indicators, shows status against target with traffic-light coloring, and surfaces trends — so the weekly business review answers "is this working?" in under 5 minutes.
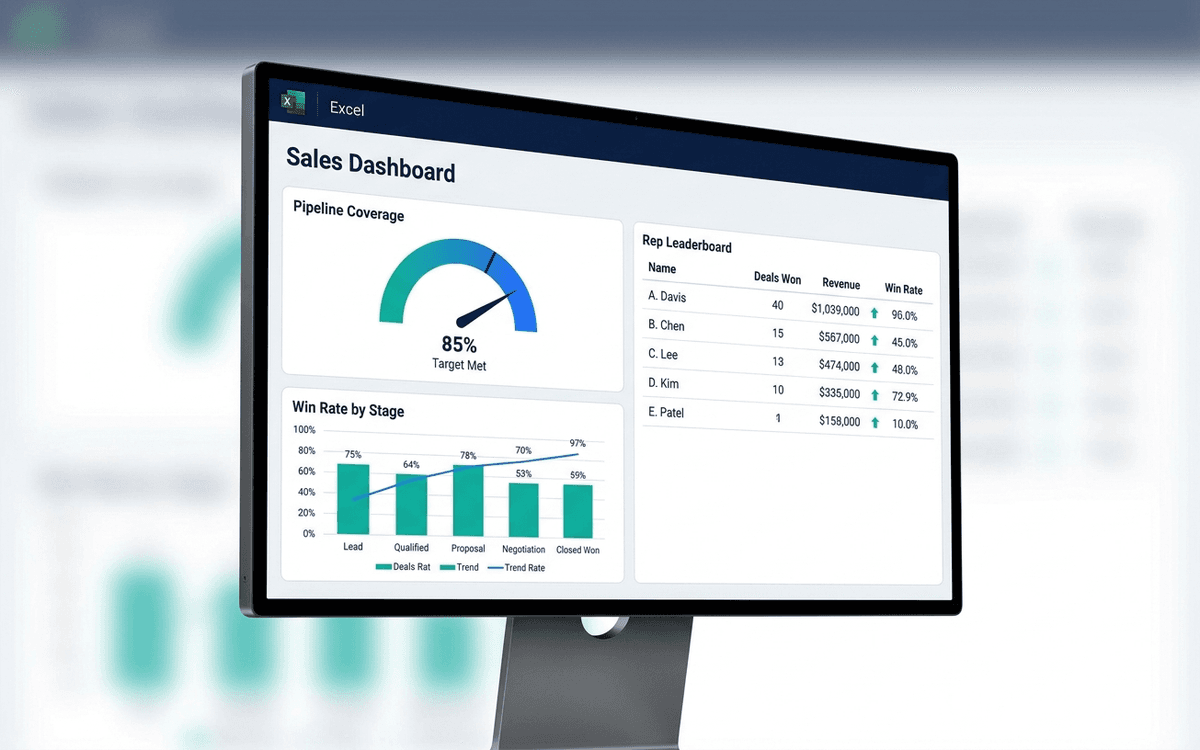
Sales Dashboard Template
A sales dashboard template covering what sales leaders actually run the team against — pipeline coverage, win rate by stage, sales cycle length, rep-level performance, and forecast accuracy — in a one-page weekly forecast call format.
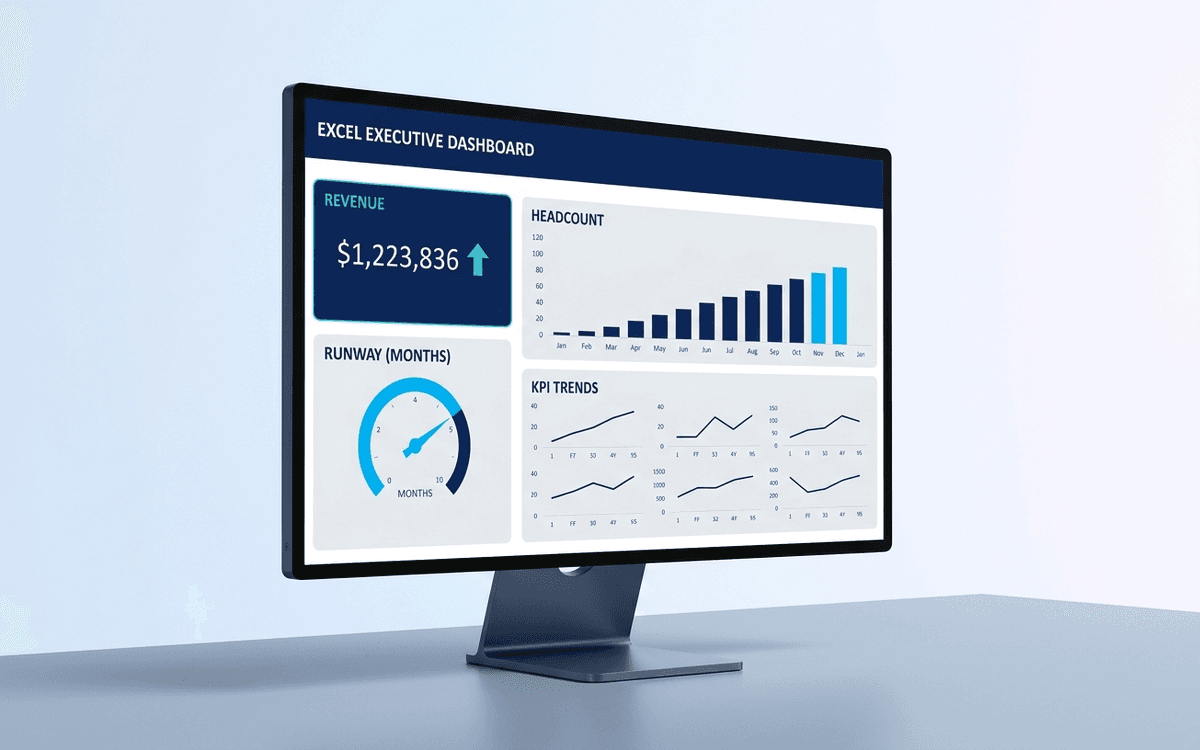
Executive Dashboard Template
An executive dashboard template gives leaders a one-page view of what actually matters — revenue, runway, headcount, and customer health — with the formulas and chart structure already built so you spend zero time formatting and all your time on the conversation.
When the template isn't enough
AppDeck's dashboards portal turns this template into a live workspace — version control, permissions, signatures, and analytics built in.