
Board Reporting Dashboard Template
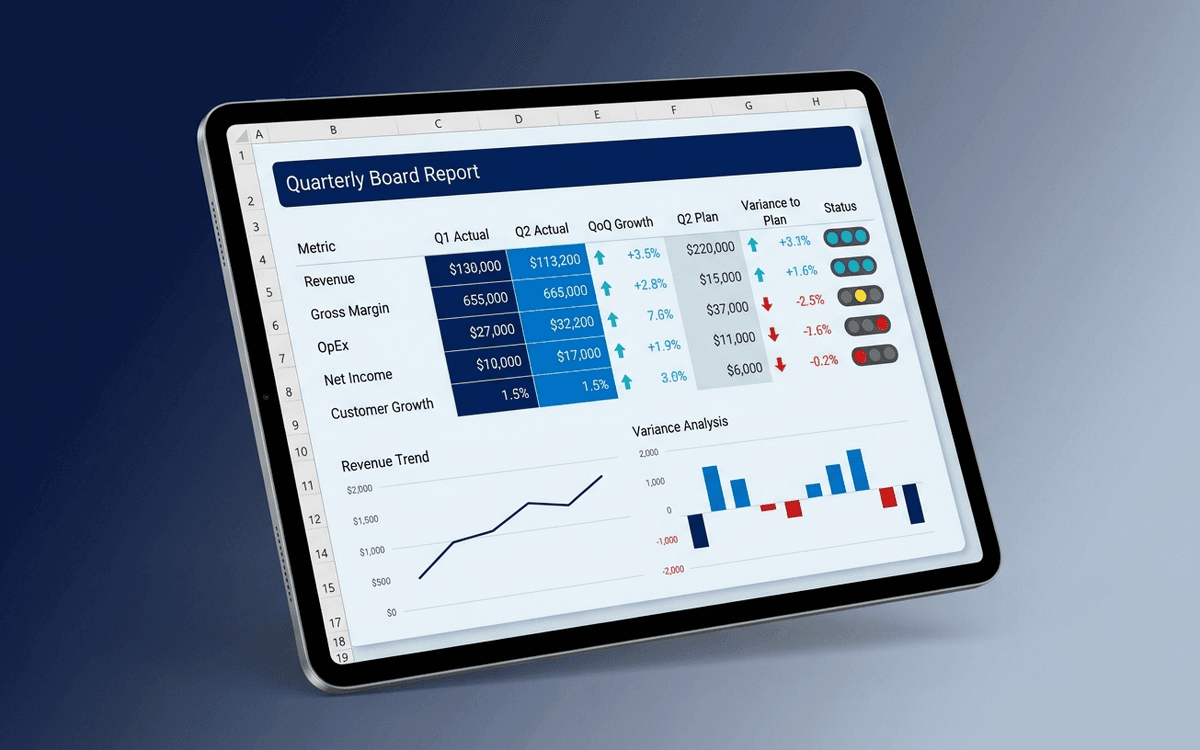
A board reporting dashboard template designed to live in the board pack — headline metrics on a single page, financial summary, KPI tracking, and quarter-over-quarter trends — in print-ready format that holds up to scrutiny.
Download this template — free
Tell us where to send the link. We'll never share your email.
What's included
- Headline metrics tile (revenue, growth, runway, headcount, customer count)
- Quarter-over-quarter and year-over-year columns
- Variance to plan + variance commentary
- Financial summary (P&L highlights)
- KPI tracking with traffic-light status
- Cohort retention and customer health summary
- Hiring plan vs. actual
- Top risks register summary
- Print-ready formatting for board pack distribution
- Source data on a separate tab
How to use this template
1. Pair the dashboard with a written narrative
A dashboard alone isn't a board report — it answers "what" without "why." Pair this dashboard with the [Board Report Template](/templates/board-report) which gives the narrative around the numbers. Directors who see both together get the full picture.
2. Lock the prior-period column at quarter close
Prior-quarter actuals shouldn't change after they're reported to the board. Lock them in. If a restatement happens, surface it explicitly ("Q2 revenue restated from $X to $Y because…") rather than silently updating the dashboard.
3. Always show variance to plan and to prior period
A number alone is meaningless. The dashboard always shows: current actual + variance to plan + variance to prior quarter. That three-way comparison is what makes a board-ready number.
4. Make it print-ready, not just screen-ready
Many directors still print the board pack. Test the dashboard at letter-size print. If text becomes unreadable or charts get clipped, fix it before distribution. The dashboard isn't doing its job if directors can't read it on paper.
5. Distribute 5–7 days before the meeting
Board dashboards distributed less than 48 hours before the meeting are functionally not pre-read. Lock the close cycle so the dashboard is final 5–7 days before the meeting. Late dashboards make for unprepared boards.
Who it's for
- Founders and CEOs producing the board pack
- CFOs preparing quarterly board reporting
- Chiefs of staff coordinating board distribution
- Boards demanding standardized dashboards
Frequently asked questions
- What's the difference between a board dashboard and a board report?
- The board dashboard is the numbers (this template). The board report is the narrative (see [/templates/board-report](/templates/board-report)). Most board packs include both — the dashboard for the data, the report for the context and asks. They complement each other.
- How many metrics should be on the board dashboard?
- 5–8 headline metrics. Above 10 it gets scanned and forgotten; below 5 it's missing context. Pick the 5–8 metrics that drive board-level decisions and let the appendix carry the rest.
- Should the board dashboard include forecasts?
- Forward-look yes, full forecasts no. Show next-quarter plan and any current-quarter trajectory; save the 3–5 year forecast for annual strategic meetings. Cluttering the board dashboard with long-horizon projections dilutes attention.
- How often does the board dashboard refresh?
- Quarterly is standard for board meetings. For monthly board updates (more common at early stage), refresh monthly. The dashboard cadence matches the board cadence — refreshing more often than the board meets adds noise without adding decisions.
- Where does the dashboard go in the board pack?
- Usually after the CEO's written update, before the deeper functional sections. Directors who only have 20 minutes hit the CEO update + the dashboard; the rest is for those going deeper. Pages 2–3 of the pack is the sweet spot.
More dashboards templates
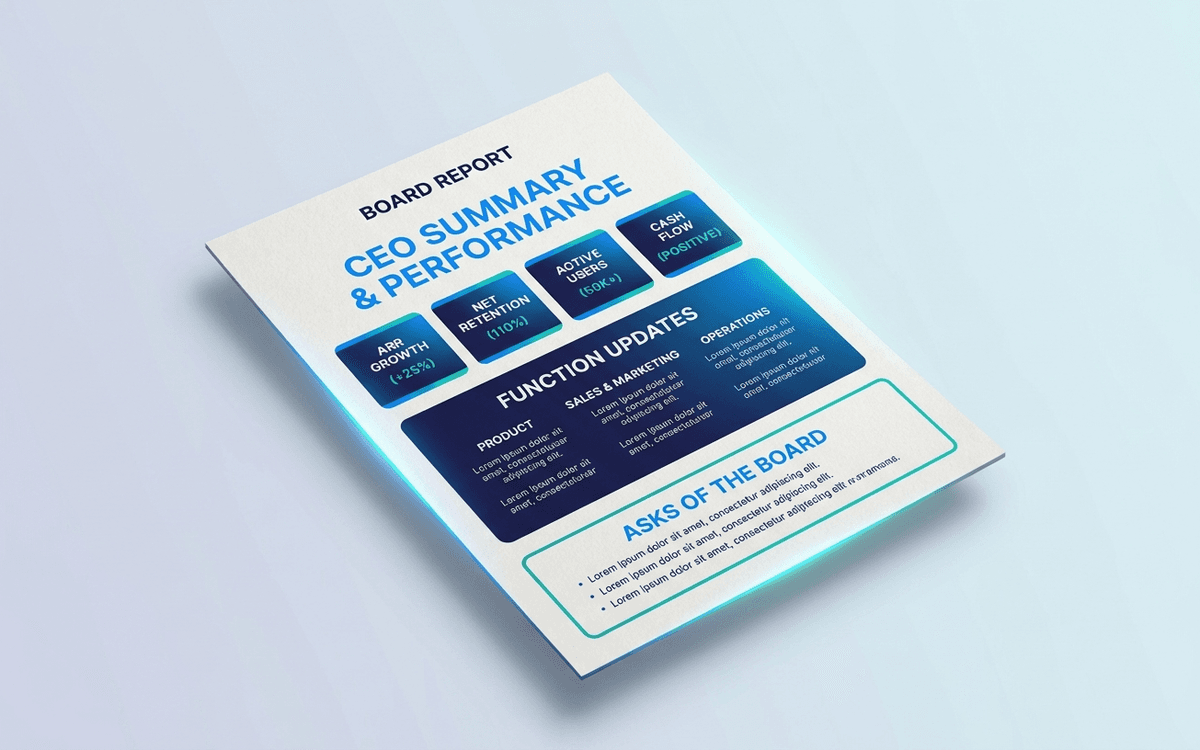
Board Report Template
A board report template structured around what directors actually want to read in the meeting — headline metrics on a single page, a narrative section per function, the specific asks of the board, and a forward-look — instead of the 40-page slide deck nobody pre-reads.
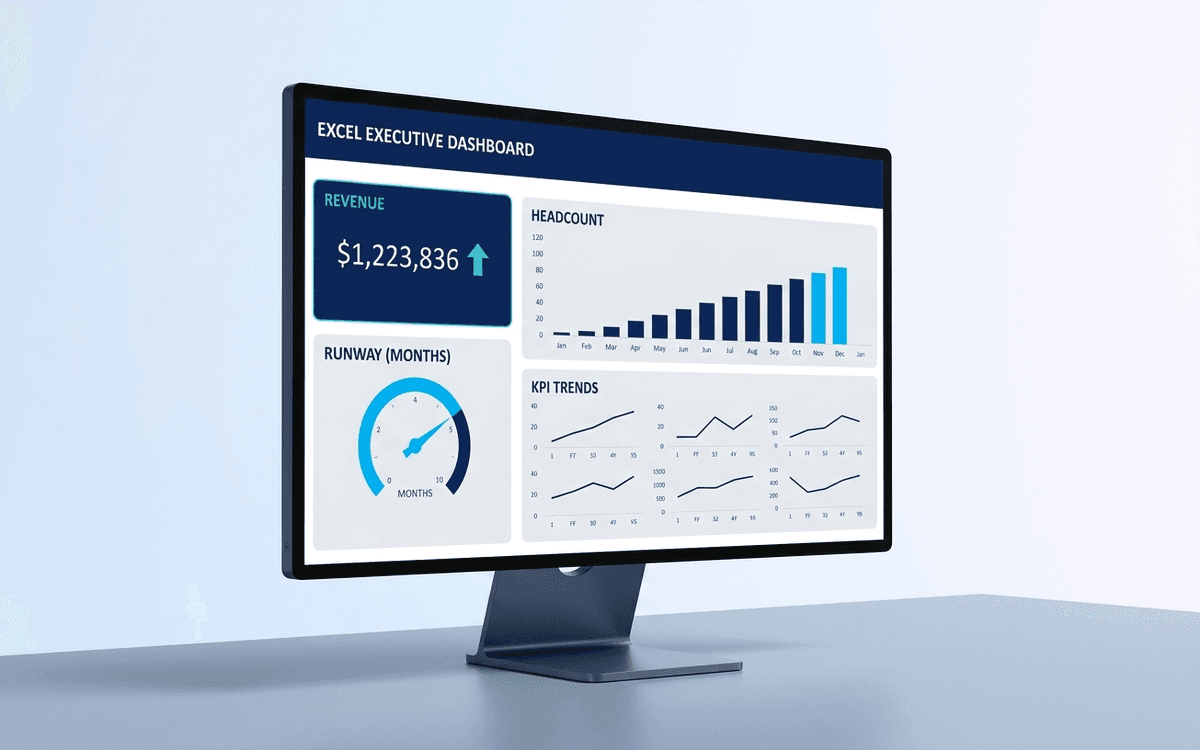
Executive Dashboard Template
An executive dashboard template gives leaders a one-page view of what actually matters — revenue, runway, headcount, and customer health — with the formulas and chart structure already built so you spend zero time formatting and all your time on the conversation.
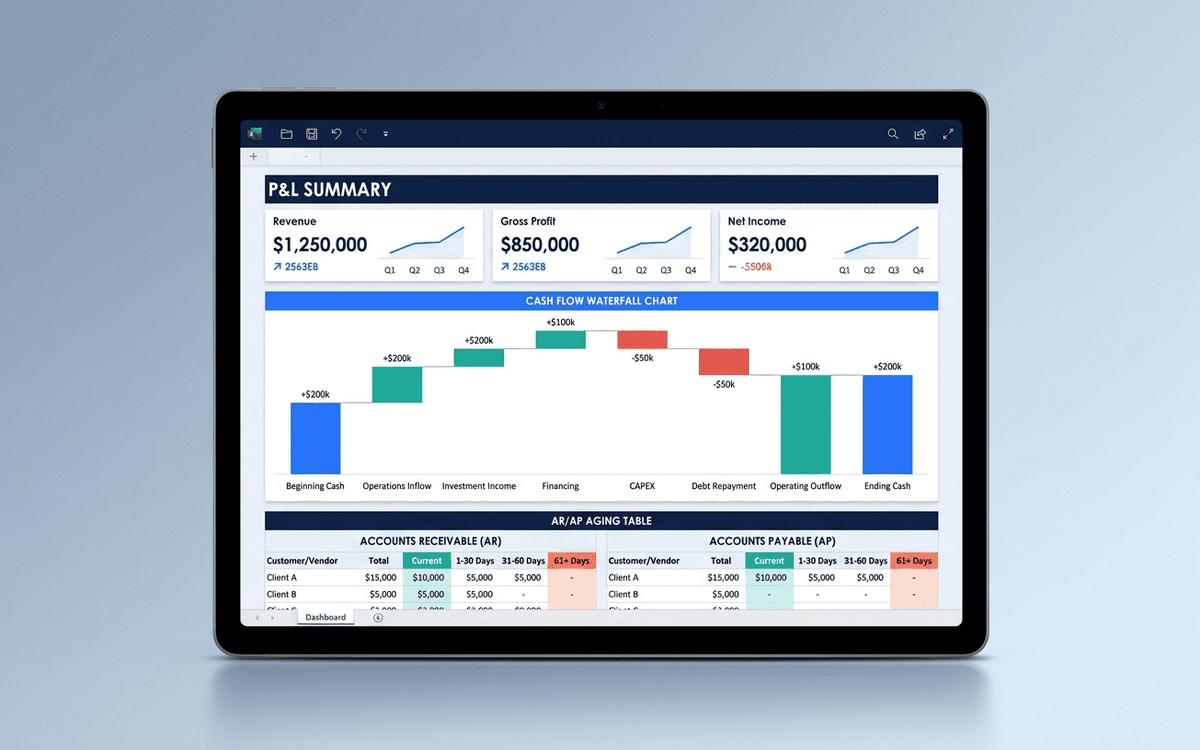
Financial Dashboard Template
A financial dashboard template that summarizes the P&L, cash flow, balance sheet, and key ratios in one page — built for the monthly finance review, ready to drop into a board pack, and small enough that a non-finance executive can actually read it.
When the template isn't enough
AppDeck's dashboards portal turns this template into a live workspace — version control, permissions, signatures, and analytics built in.