
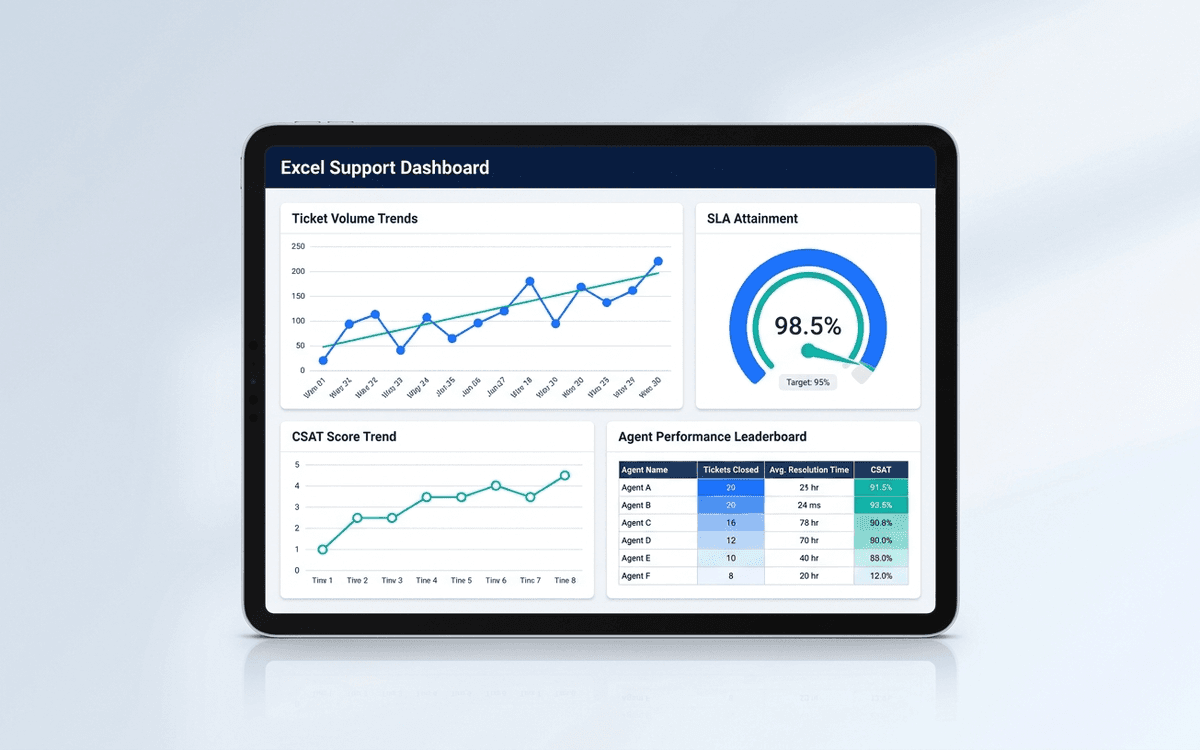
Support Dashboard Template
A support dashboard template covering ticket volume, response and resolution times, CSAT, queue health, and agent performance — in a one-page daily standup format that surfaces SLA risks before they become escalations.
Download this template — free
Tell us where to send the link. We'll never share your email.
What's included
- Ticket volume by channel (email, chat, phone, in-app)
- First response time and full resolution time by priority
- SLA attainment by tier
- Queue depth and aging
- CSAT and NPS trend
- Top issue categories (where tickets cluster)
- Agent performance: tickets resolved, average time, CSAT, escalation rate
- Re-open rate (tickets reopened after marked resolved)
- Source data on a separate tab
How to use this template
1. Tier tickets before measuring anything
Mixing P1 and P4 tickets in averaging makes the dashboard meaningless. Establish priority tiers (P1 = system down / business stopped, P2 = significant impact, P3 = standard, P4 = enhancement). Report SLA attainment per tier; never report blended response time.
2. Track first response separately from resolution
Customers care about acknowledgement (first response) and outcome (resolution) differently. The dashboard tracks both as separate SLAs. Best-in-class first response: under 1 hour for P1, under 4 hours for P2, under 24 hours for P3+.
3. Categorize tickets to find systemic issues
Top issue categories is the most valuable section. If 30% of tickets are about onboarding confusion, you have a product problem, not a support problem. The dashboard surfaces the top 5 categories so they become product/engineering inputs, not just support volume.
4. Watch re-open rate carefully
High volume + high CSAT + high re-open rate = agents are closing tickets too aggressively to hit metrics. Re-open rate is the integrity check on the rest of the dashboard. Target: under 5%. Above 10% means your other metrics are gamed.
5. Run daily standup off the dashboard
Support is one of the few functions where daily review is genuinely useful — backlog grows fast and SLA breaches happen overnight. A 10-minute morning standup with the dashboard catches issues before they escalate. Weekly review is too late for support ops.
Who it's for
- Heads of Customer Support running daily standups
- Support managers building team-level reporting
- CX leaders tying support to retention
- COOs evaluating outsourced support vendors
Frequently asked questions
- What ticket priority system should we use?
- A 4-tier system works for most companies: P1 (system down, business stopped), P2 (significant impact, workaround exists), P3 (standard issue, no immediate business impact), P4 (enhancement request, low urgency). Tier each ticket on intake — re-tiering later distorts SLA reporting.
- What CSAT score should we target?
- Above 90% is best-in-class; 85–90% is healthy; below 80% suggests a systemic problem. Note: CSAT inflation is real — agents who close tickets quickly without resolution often score high CSAT short-term but high re-open rate eventually. Watch both.
- What's a healthy ticket-to-MRR ratio?
- Highly dependent on product complexity and customer base. SaaS rule of thumb: 0.1–0.3 tickets per customer per month. Above 0.5 suggests a product issue or onboarding gap. Below 0.1 might be too low (customers aren't engaging enough to find issues).
- Should we share the dashboard with the support team?
- Yes — the operating sections (queue depth, SLA, top categories). Keep agent-level performance sections in a separate manager view. Agent-level metrics shared broadly turn into gaming behavior; agent-level metrics in 1:1s become coaching conversations.
- When do we outgrow Excel for support?
- When you're on a real ticketing platform (Zendesk, Intercom, Help Scout, Freshdesk), the platform itself usually has built-in reporting. The Excel template is most useful for: (a) very early stage, (b) post-mortem analysis of trends, or (c) reporting up to executives who don't use the ticketing platform.
More dashboards templates
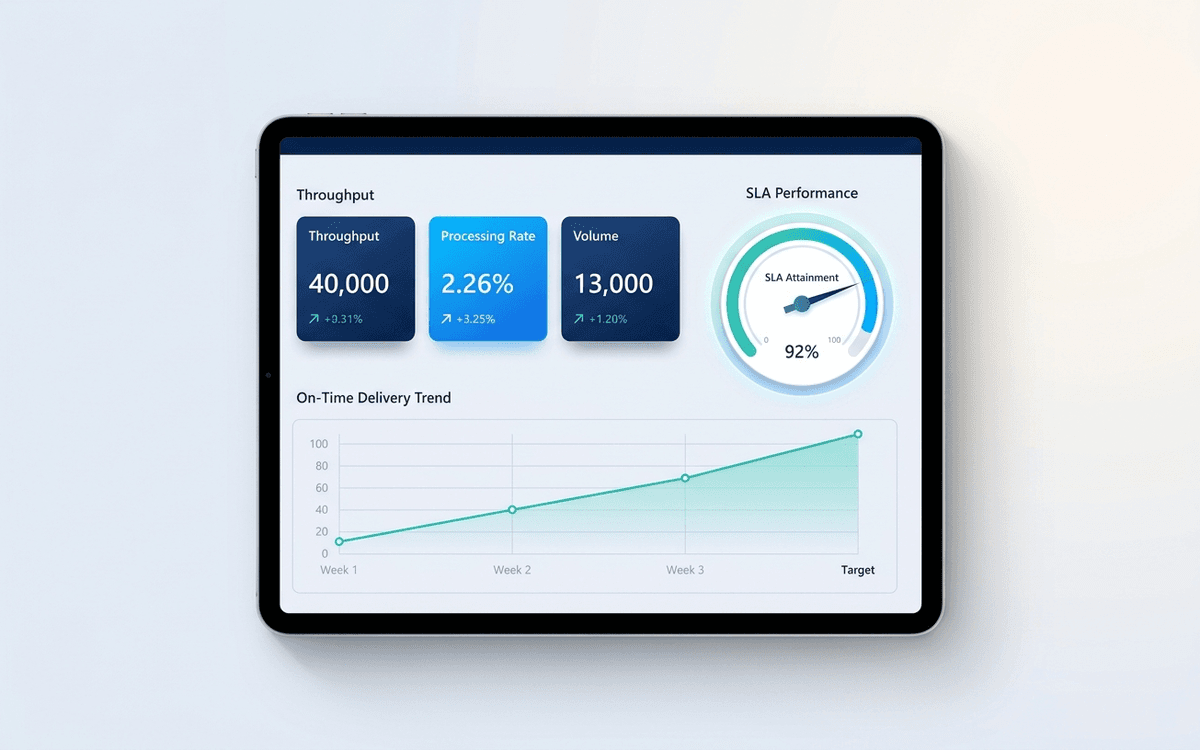
Operations Dashboard Template
An operations dashboard template that tracks the levers operators actually pull — throughput, SLA attainment, quality, capacity utilization, and on-time delivery — in a one-page weekly review format.
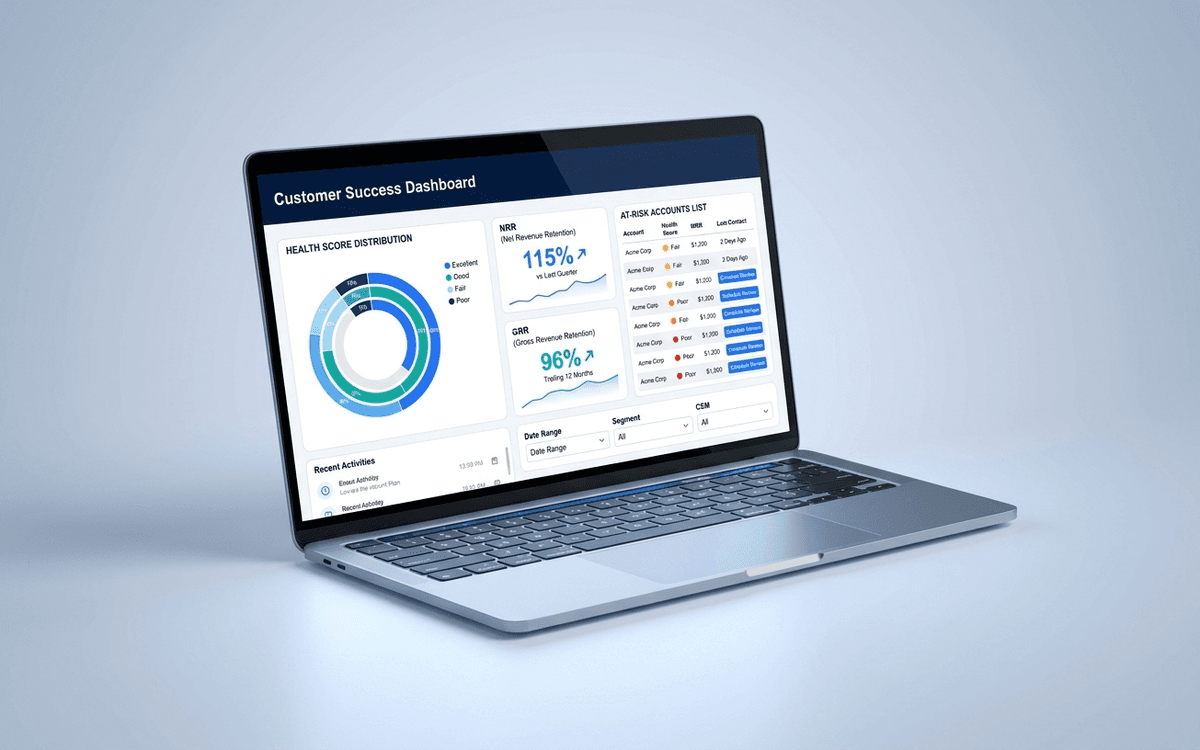
Customer Success Dashboard Template
A customer success dashboard template that tracks what CS leaders actually run the team against — health score distribution, net and gross retention, expansion pipeline, at-risk accounts, and CSM book of business — in a weekly review format.
When the template isn't enough
AppDeck's dashboards portal turns this template into a live workspace — version control, permissions, signatures, and analytics built in.