
Project Status Dashboard Template
A project status dashboard template that surfaces what stakeholders actually want to know — milestone progress, RAG status, budget variance, and the top three risks — in a one-page weekly status report that doesn't take an hour to update.
Download this template — free
Tell us where to send the link. We'll never share your email.
What's included
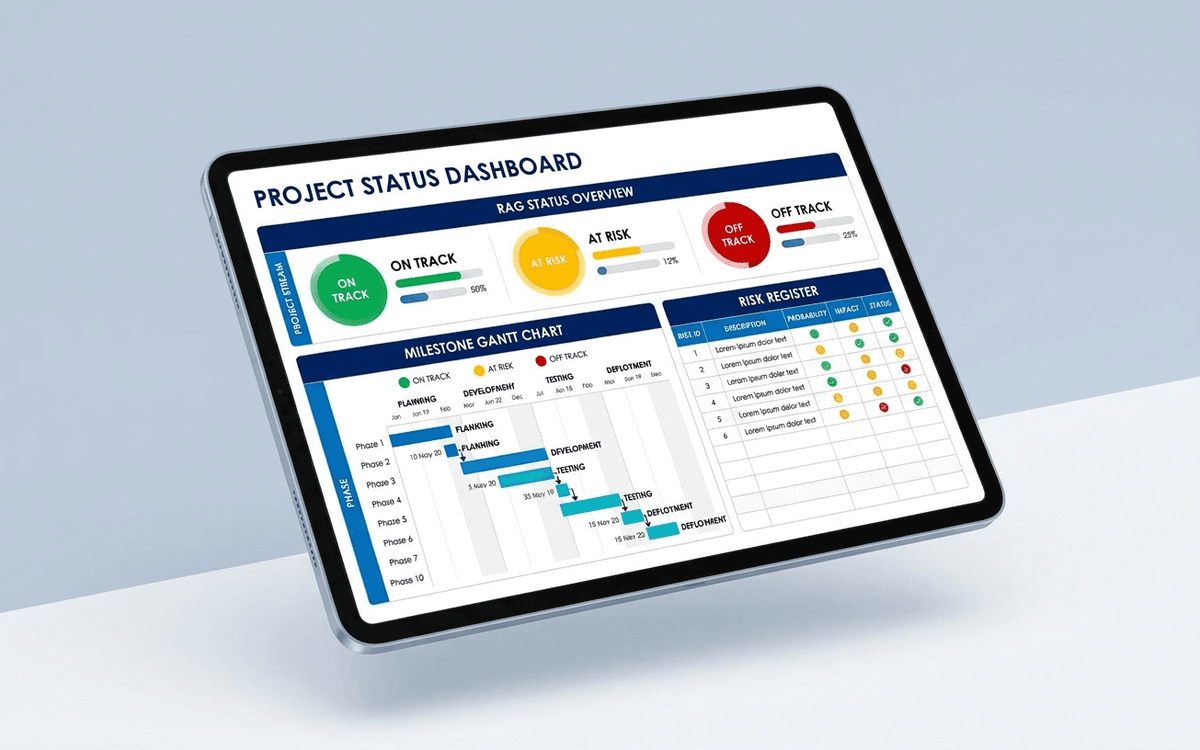
- Overall RAG status (Red / Amber / Green) with one-line rationale
- Milestone schedule (planned vs. actual)
- Workstream-level RAG breakdown
- Budget vs. actual spend by phase
- Schedule variance and earned value indicators
- Top 5 risks with mitigation status
- Top 3 open decisions awaiting sponsor
- Action items log with owner and due date
How to use this template
1. Lock the RAG definitions before week 1
RAG status is meaningless if every PM defines it differently. Lock the definitions before the project starts: Green = on track to deliver scope on time and budget; Amber = at risk, needs attention; Red = will miss without intervention. Apply consistently. The discipline matters more than the system.
2. Write the one-line rationale every time
Every RAG entry needs a one-sentence "why" — what's driving the color this week, and what changed since last week. Without rationale, the status is just a color; with it, it's a conversation starter.
3. Track top 5 risks, not all risks
Every project has 30+ risks; surfacing them all dilutes attention. The dashboard surfaces only the top 5 by combined likelihood × impact. The full risk register lives in a separate tab (or document) — the dashboard shows what the sponsor needs to act on this week.
4. Pair the dashboard with a weekly status call
The dashboard is the artifact. The conversation is where decisions get made. Use the dashboard to anchor a 30-minute weekly call with sponsors — walk through any RAG changes, the top 5 risks, and any open decisions. Don't email the dashboard and call it status.
5. Archive a snapshot weekly
Save a date-stamped snapshot of the dashboard every week. The historical record matters for retrospectives — and shows the sponsor when status was first flagged Amber on a milestone that ultimately slipped. This is a small habit with high payoff at project close.
Who it's for
- Project managers running structured engagements
- PMO leads standardizing reporting across projects
- Agency account leads reporting to clients
- Implementation teams reporting to executive sponsors
Frequently asked questions
- What is a RAG status?
- RAG = Red / Amber / Green — a simple traffic-light system for communicating project health. Green = on track; Amber = at risk, needs attention; Red = will miss without intervention. Each RAG should be paired with a one-line rationale and a one-line recommended action.
- How often should the project dashboard update?
- Weekly for most engagements. Daily for short, intensive efforts (migrations, launches, recoveries). Monthly is too slow — by the time a Red status shows up monthly, the slip has already happened.
- What's the difference between a project dashboard and a status report?
- The dashboard is the visual artifact (charts, RAGs, milestones). The status report is the narrative wrapper around it (what happened, what's next, asks of the sponsor). A good weekly update has both — the dashboard for at-a-glance state, the narrative for context. Many teams collapse them into a single page.
- Should we share the dashboard with the client?
- Yes, in almost every services and consulting engagement. Clients who see the dashboard have realistic expectations and become better partners on risk mitigation. Withhold only items that involve confidential vendor or team-internal matters; everything else helps.
- When do we need real project management software instead?
- When you're running 5+ projects in parallel, when multiple PMs need a consolidated view, or when stakeholders want live updates without waiting for the weekly refresh. Asana, Monday, Jira, ClickUp, and Smartsheet all handle multi-project dashboards. The Excel template is right for single high-stakes engagements.
More dashboards templates
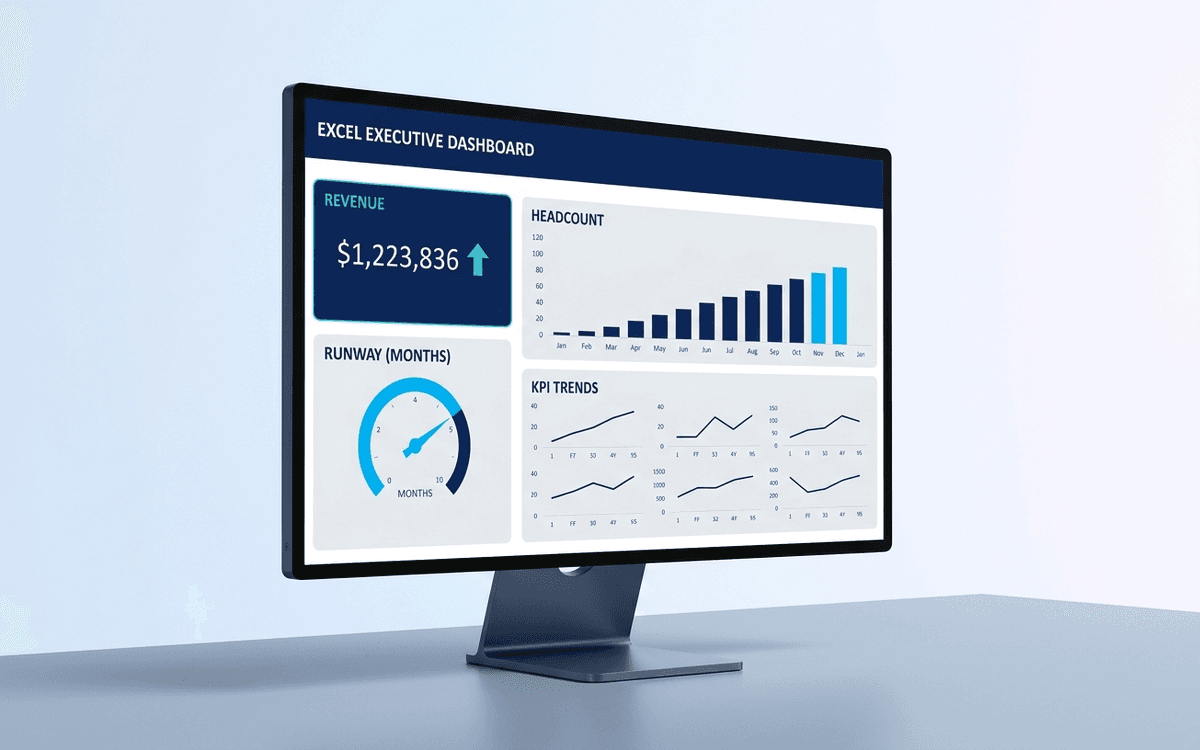
Executive Dashboard Template
An executive dashboard template gives leaders a one-page view of what actually matters — revenue, runway, headcount, and customer health — with the formulas and chart structure already built so you spend zero time formatting and all your time on the conversation.
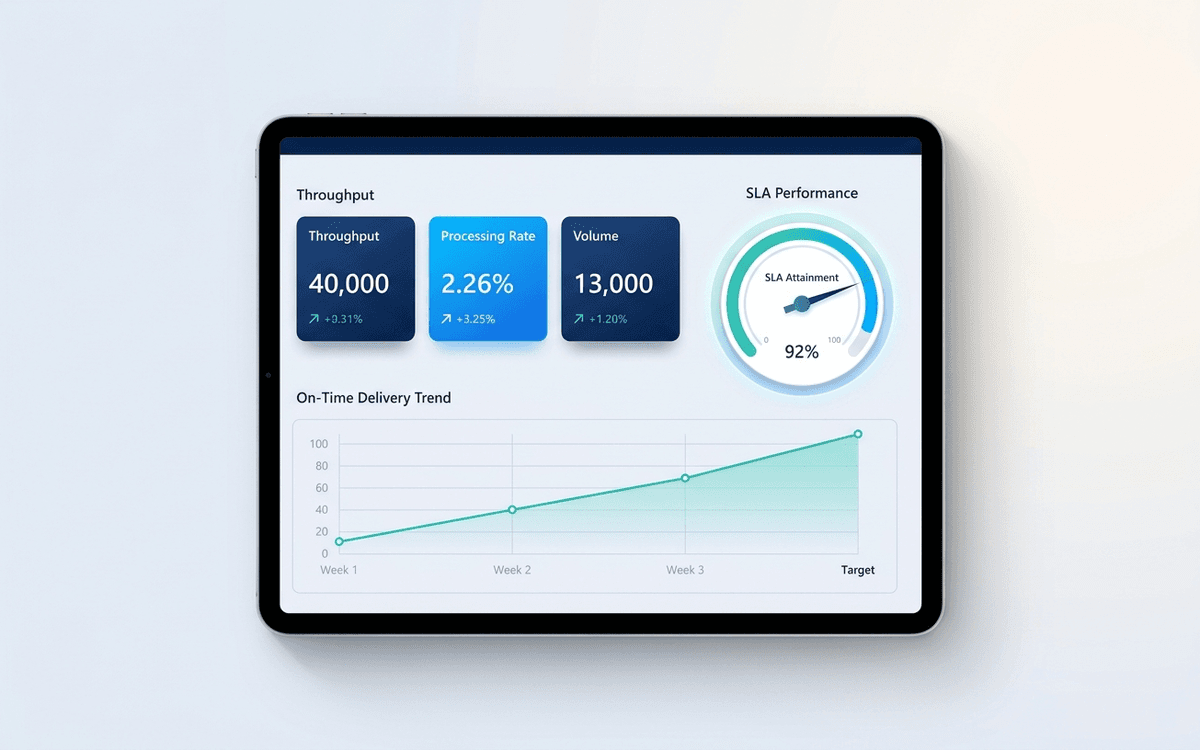
Operations Dashboard Template
An operations dashboard template that tracks the levers operators actually pull — throughput, SLA attainment, quality, capacity utilization, and on-time delivery — in a one-page weekly review format.
When the template isn't enough
AppDeck's dashboards portal turns this template into a live workspace — version control, permissions, signatures, and analytics built in.