
Inventory Dashboard Template
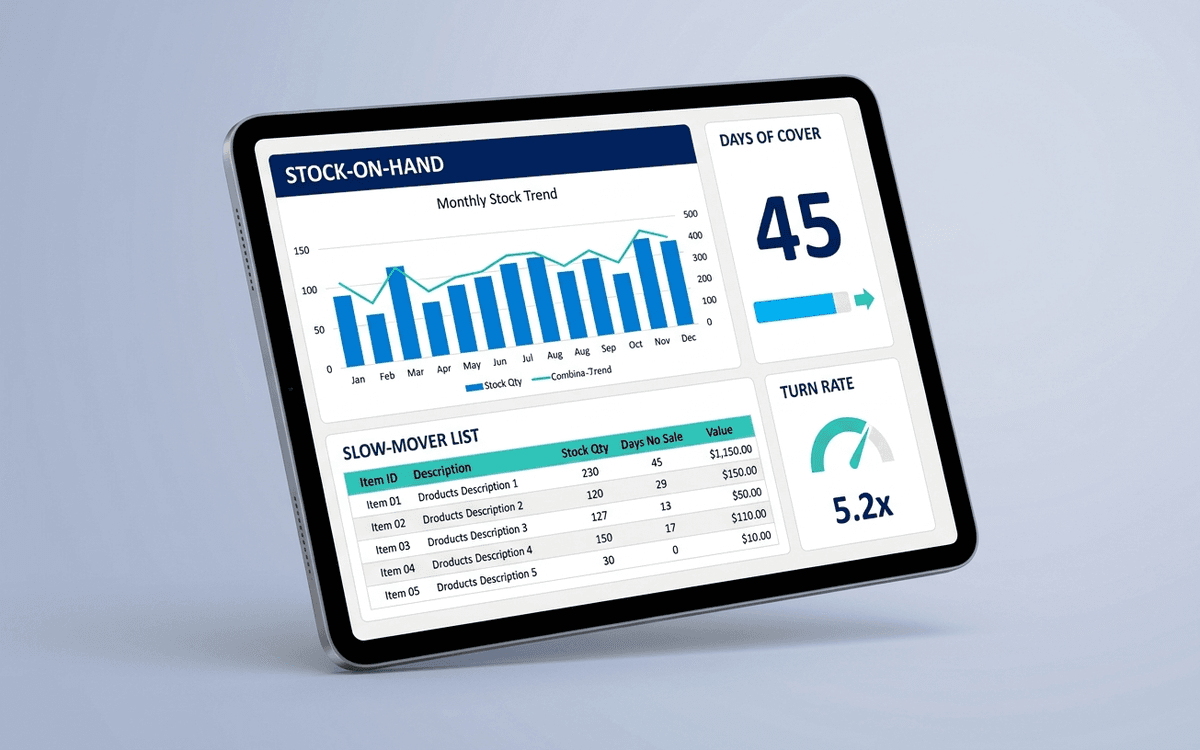
An inventory dashboard template tracking stock-on-hand by SKU, days of cover, turn rate, slow-movers, and dynamic reorder points — so you stop both stocking out on hot SKUs and tying up cash in slow ones.
Download this template — free
Tell us where to send the link. We'll never share your email.
What's included
- Stock-on-hand by SKU with reorder point flags
- Days of cover at current sell-through rate
- Inventory turn rate (annualized)
- Slow-mover report (no sales in 60/90/180 days)
- Out-of-stock incidents and revenue impact
- Overstock report (>180 days of cover)
- Cost of goods tied up by SKU
- Open purchase orders and expected receive dates
- Source data on a separate tab
How to use this template
1. Set reorder points based on lead time + safety stock
Reorder point = (daily sales × lead time in days) + safety stock. The dashboard calculates this automatically per SKU; you only need to enter lead time and safety-stock factor. SKUs trending below reorder point trigger the flag.
2. Watch the slow-mover report monthly
SKUs with no sales in 60/90/180 days are usually candidates for: markdown, bundling, sunset, or returning to supplier. Cash tied up in slow inventory has a real opportunity cost. The dashboard surfaces this monthly so you act on it instead of letting it pile up.
3. Measure turn rate, not just inventory value
Inventory turn = COGS / average inventory. Higher turn = healthier business. Industry benchmarks: apparel 4–6x, electronics 5–10x, grocery 12–20x. Falling turn is one of the earliest signals of overstocking before it shows up in cash flow.
4. Track out-of-stock revenue impact
Out-of-stock isn't just a fulfillment problem — it's lost revenue. The dashboard estimates lost revenue from OOS events using historical sell-through rates. Surfacing the dollar amount makes the case for safer stock levels much stronger.
5. Build the days-of-cover view per SKU class
A blended "days of cover" number is misleading. Hot SKUs running at 5 days of cover are about to stock out; slow SKUs at 5 days of cover are well-stocked. Segment by velocity (top 20% / middle / long tail) and target days-of-cover separately for each.
Who it's for
- DTC and ecommerce operators
- Inventory and supply chain managers
- CFOs at physical-product businesses
- Small manufacturers and wholesalers
Frequently asked questions
- What's a good inventory turn rate?
- Industry-dependent. Apparel: 4–6 turns/year. Electronics: 5–10. Furniture: 3–5. Food/beverage: 12–20. Higher is better — capital turns more often. Compare against YOUR trend more than benchmarks.
- How much safety stock should I carry?
- Standard formula: safety stock = (max daily sales − average daily sales) × max lead time days. For volatile SKUs, this can run 2–4 weeks of cover. For predictable SKUs, 1–2 weeks. Set per-SKU, not blended.
- What's the difference between FIFO and weighted average costing?
- FIFO (First-In-First-Out) records cost based on the oldest inventory sold; weighted average uses the average cost across all inventory. FIFO matches physical flow for perishables; weighted average is simpler for non-perishables. Pick one and stick with it — switching mid-year creates accounting issues.
- How often should I do physical inventory counts?
- Cycle counts (rolling counts of a subset weekly) beat annual full counts. Target: every SKU counted at least quarterly. Annual full counts are accounting-mandatory in some jurisdictions; cycle counts catch shrinkage faster.
- When do I outgrow Excel for inventory?
- Around $1M+ annual revenue, 100+ active SKUs, or when inventory becomes multi-location. Cin7, Katana, NetSuite, Brightpearl, and platform-specific tools (Shopify's inventory features, Amazon FBA inventory tools) all replace the spreadsheet.
More dashboards templates
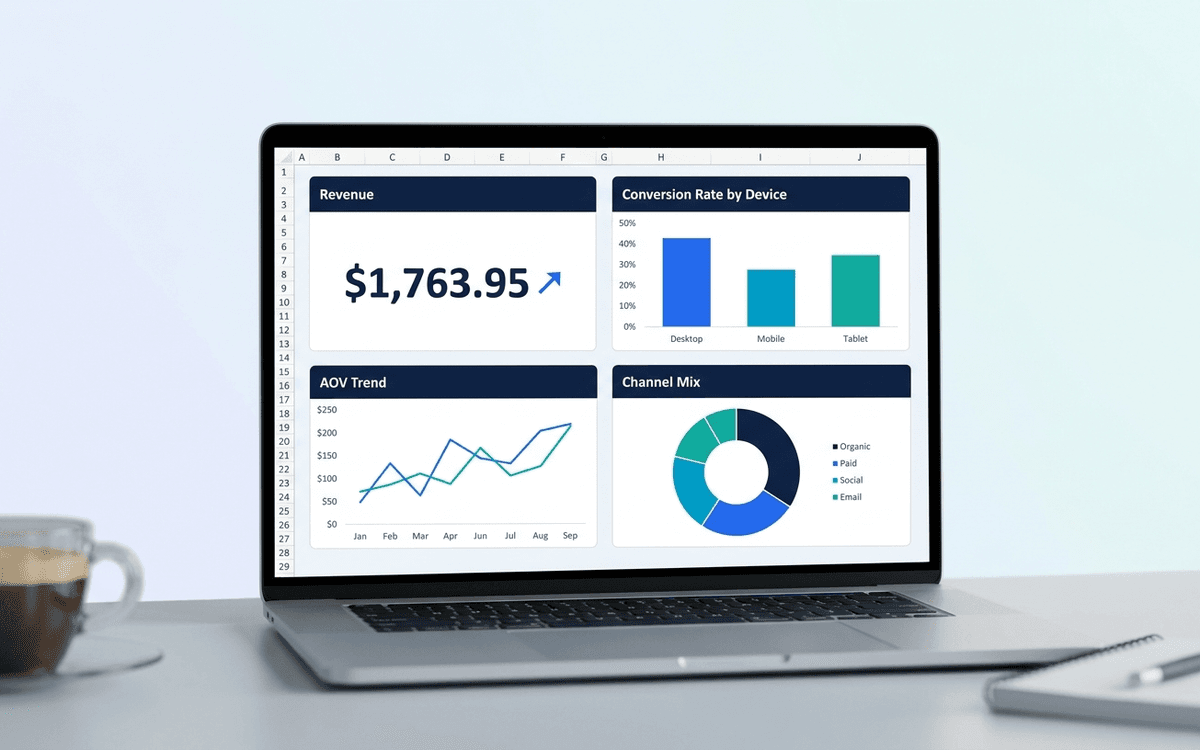
Ecommerce Dashboard Template
An ecommerce dashboard template covering the metrics DTC operators actually run on — revenue, AOV, conversion rate, cart abandonment, channel mix, and cohort retention — laid out as a one-page daily/weekly view.
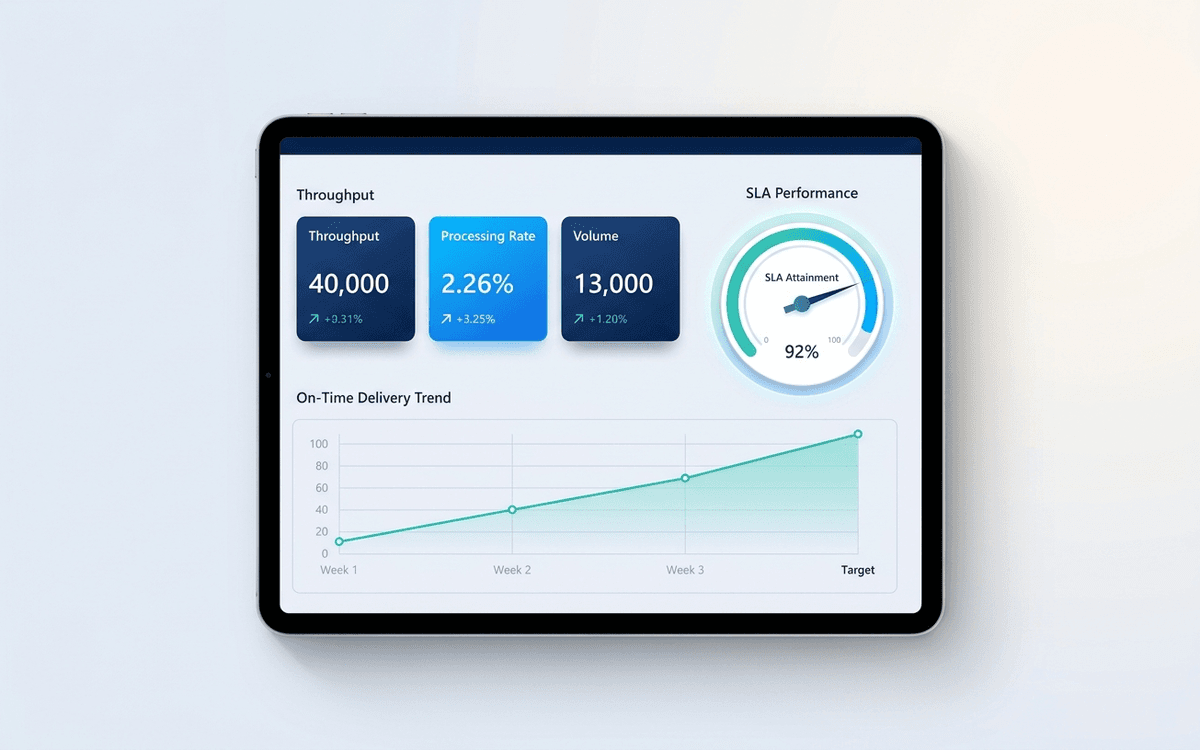
Operations Dashboard Template
An operations dashboard template that tracks the levers operators actually pull — throughput, SLA attainment, quality, capacity utilization, and on-time delivery — in a one-page weekly review format.
When the template isn't enough
AppDeck's dashboards portal turns this template into a live workspace — version control, permissions, signatures, and analytics built in.