
Ecommerce Dashboard Template
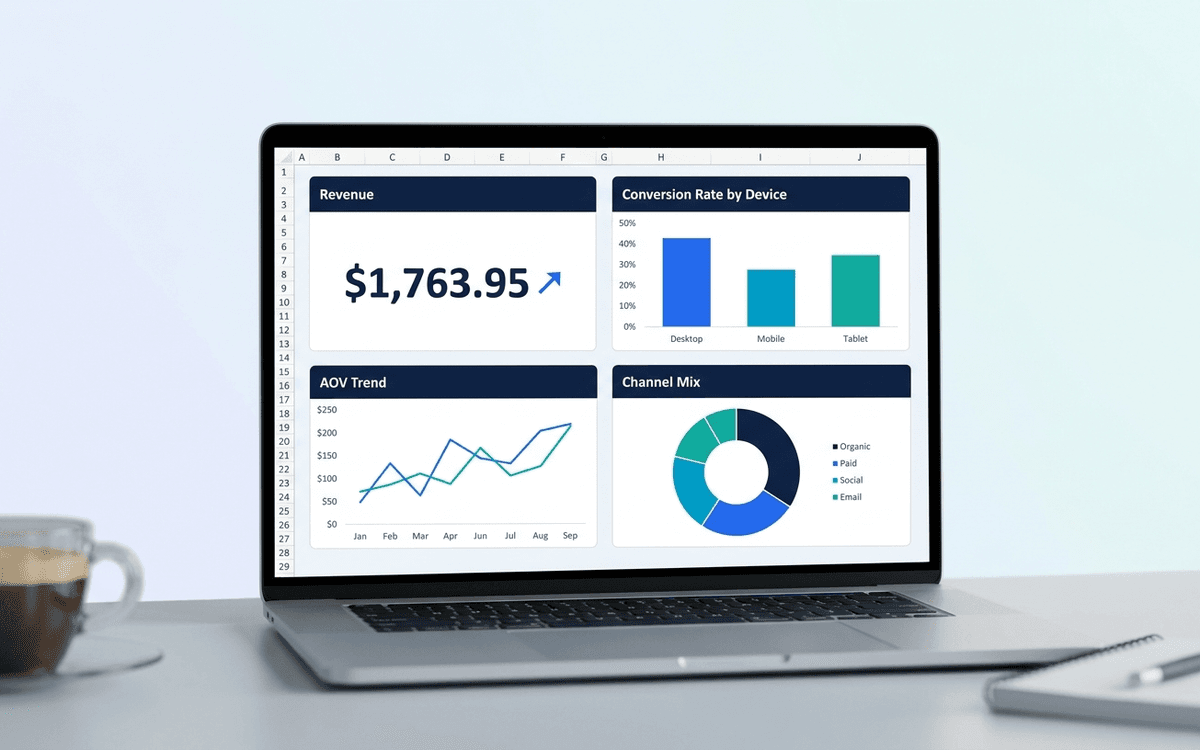
An ecommerce dashboard template covering the metrics DTC operators actually run on — revenue, AOV, conversion rate, cart abandonment, channel mix, and cohort retention — laid out as a one-page daily/weekly view.
Download this template — free
Tell us where to send the link. We'll never share your email.
What's included
- Revenue tile with day-over-day and week-over-week
- Average Order Value (AOV) and basket size
- Conversion rate by channel and device
- Cart abandonment rate
- Traffic by channel (paid, organic, social, email, direct)
- New customer vs. repeat customer split
- Cohort retention table
- Top SKUs by revenue and margin
- Return rate and reason codes
- Source data on a separate tab
How to use this template
1. Run daily, not weekly
Ecommerce signals move fast. Daily review catches issues — broken checkout, paid campaign degradation, supply issues — within 24 hours. Weekly review lets a week of bad data accumulate. Make daily review a 5-minute morning habit.
2. Watch conversion rate by device separately
Mobile and desktop conversion rates are usually different by 2–3x. A blended conversion rate hides device-specific issues. Split it. Mobile share of traffic keeps growing, so mobile conversion deserves dedicated attention.
3. Track new vs. repeat revenue separately
New customer acquisition and repeat purchase are two different businesses — different unit economics, different optimization levers. The dashboard splits them so you see when growth is being subsidized by new customer paid acquisition vs. organic repeat.
4. Build cohort retention from week 1
Cohort retention (% of customers from month X who purchased again in months X+1, X+2…) is the single most predictive metric in DTC. Set it up early even when the cohorts are small. By month 12 you'll have the most useful chart in the business.
5. Pair revenue with margin, not just gross
Gross revenue without margin is misleading in ecommerce — a promotional period can spike revenue while destroying margin. The dashboard tracks contribution margin alongside revenue. Healthy DTC: 30%+ contribution margin after COGS, fulfillment, and ad spend.
Who it's for
- DTC and ecommerce operators
- Shopify, BigCommerce, WooCommerce store owners
- Ecommerce marketing leads
- Heads of growth at consumer brands
Frequently asked questions
- What's a good ecommerce conversion rate?
- Industry-dependent. Apparel: 1.5–3%. Beauty: 2–4%. Home goods: 1–3%. Food/beverage: 2–5%. Track YOUR trend, not benchmarks — a 1% conversion rate that's trending up is better than a 3% rate that's trending down.
- What's a healthy AOV trend?
- Slowly rising. Brands that grow AOV faster than inflation are usually doing successful bundling, premium-tier expansion, or upsell. Falling AOV often signals over-discounting or shifting to lower-margin SKUs.
- How do I reduce cart abandonment?
- Three biggest levers: (1) reduce friction at checkout (guest checkout, fewer fields, multiple payment methods), (2) clarify shipping cost early (shipping shock is the #1 abandon reason), (3) recover via email/SMS within 1 hour. Industry baseline is 65–75% abandonment; under 60% is excellent.
- Should I track LTV or just revenue?
- Both. Revenue is the operating dashboard; LTV is the strategic one. LTV by acquisition channel tells you which paid channels are sustainable. Many DTC brands look profitable on revenue and unprofitable on LTV-adjusted spend.
- When do we outgrow Excel for ecommerce?
- When your platform's built-in reporting starts feeling limiting (usually around $1M annual revenue), when you need multi-source consolidation (Shopify + Amazon + retail + paid platforms), or when daily review takes more than 10 minutes. Polar Analytics, Triple Whale, Sweetspot, and Glew are common upgrades.
More dashboards templates
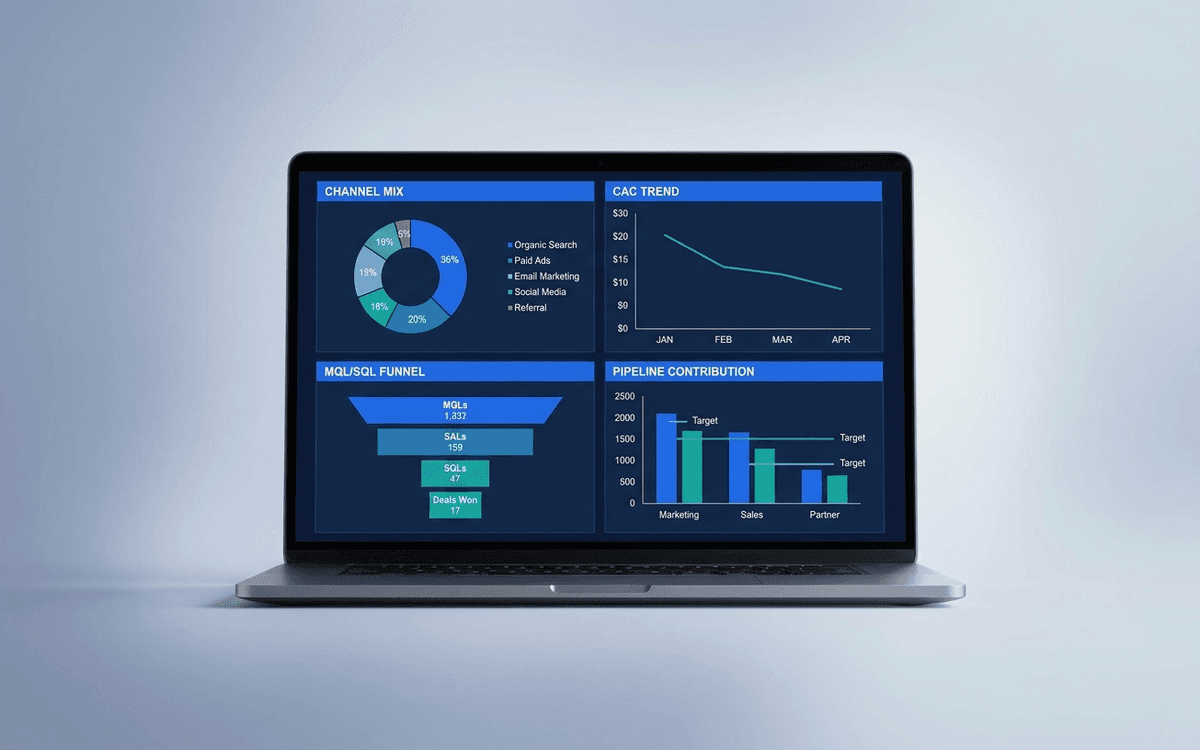
Marketing Dashboard Template
A marketing dashboard template covering the metrics CMOs actually defend — channel mix, blended CAC, MQL/SQL conversion, marketing-sourced pipeline, and ROI per program — in a one-page weekly review that ties spend to outcomes.
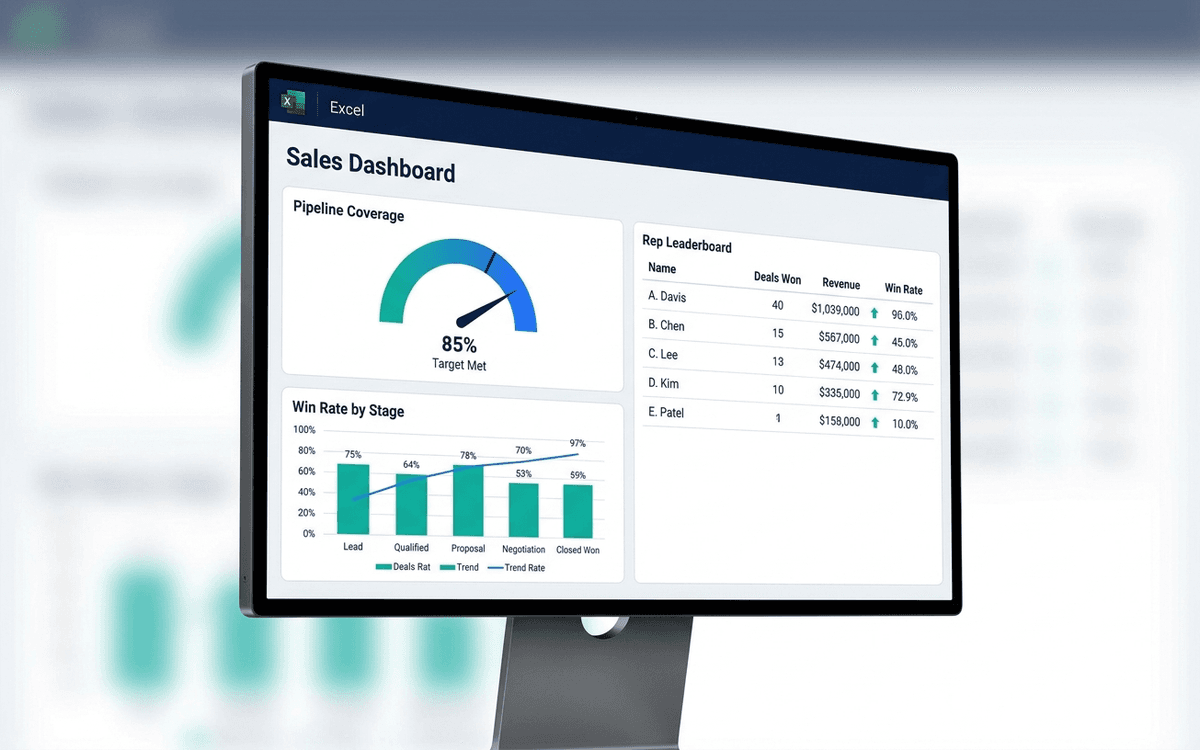
Sales Dashboard Template
A sales dashboard template covering what sales leaders actually run the team against — pipeline coverage, win rate by stage, sales cycle length, rep-level performance, and forecast accuracy — in a one-page weekly forecast call format.
When the template isn't enough
AppDeck's dashboards portal turns this template into a live workspace — version control, permissions, signatures, and analytics built in.