
Agency Utilization Dashboard Template
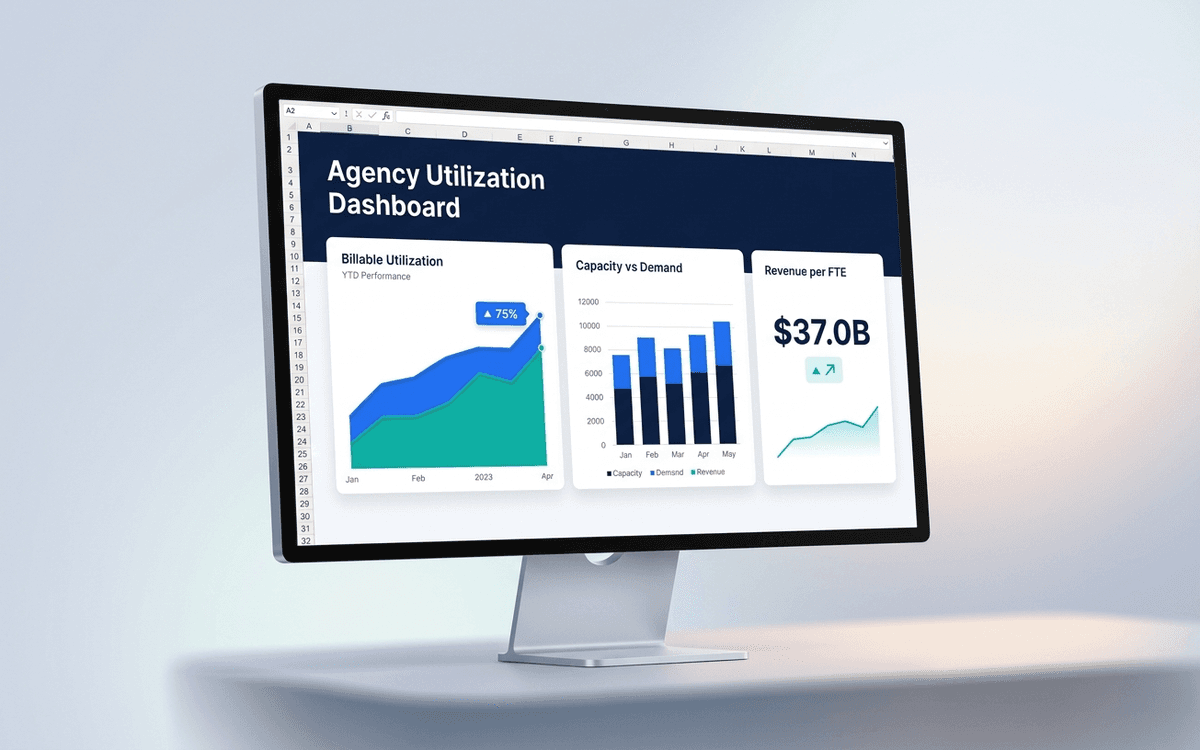
An agency utilization dashboard template tracking what agency owners actually run the business on — billable utilization by person, capacity vs. demand, revenue per FTE, and project margin — in a weekly format that surfaces under-utilization before payroll does.
Download this template — free
Tell us where to send the link. We'll never share your email.
What's included
- Billable utilization by person (target vs. actual)
- Capacity vs. demand by skill / discipline
- Revenue per FTE
- Project margin by client and project
- Effective hourly rate by client
- Backlog (signed work) in weeks of cover
- Pipeline forecast vs. capacity
- Time-off and non-billable allocation
- Source data on a separate tab
How to use this template
1. Set utilization targets by role, not blended
Senior creatives and engineers might target 65–75% billable; juniors target 80%+; project managers 50–60%. A blended 75% target misallocates. The dashboard tracks per-role; set targets explicitly per role.
2. Track effective rate, not just billed rate
Billed rate is what you charge per hour. Effective rate is total project revenue divided by hours actually worked (often higher than billed because of fixed-fee work). Effective rate is the real number; it shows whether you're scoping correctly.
3. Watch capacity-vs-demand by skill
You can have 75% blended utilization and still be 130% utilized on motion graphics and 40% utilized on strategy. The dashboard surfaces capacity by skill so hiring decisions match where the bottleneck actually is.
4. Pair utilization with margin
High utilization at low margin is a worse problem than low utilization at high margin. The dashboard pairs the two: high-utilization clients with low margin become candidates for rate increases or scope renegotiation.
5. Forecast backlog in weeks, not dollars
Dollars in pipeline can be huge while the team is starving for billable hours next month. Backlog in weeks of cover (signed work / weekly billable capacity) is the right operational metric. 4–6 weeks of cover is healthy for agencies; under 2 weeks is panic territory.
Who it's for
- Agency owners and managing directors
- Studio heads at design/dev/marketing agencies
- Consulting firm partners running utilization
- Operations leaders at professional services firms
Frequently asked questions
- What's a good billable utilization rate?
- Depends on role. Industry benchmarks: senior creative/engineering 65–75%, junior 80–85%, project management 50–60%, leadership 30–50%. Anything over 85% is unsustainable; under 55% (for delivery roles) signals capacity vs. demand mismatch or pricing problems.
- How do I calculate effective hourly rate?
- Total project revenue / total hours worked on the project (billable + non-billable). For T&M projects, effective rate ≈ billed rate. For fixed-fee, effective rate is often higher (if scoped well) or lower (if scoped poorly). The gap between effective rate and billed rate is your scoping accuracy.
- Should we track non-billable hours?
- Yes — every hour. Without tracking non-billable, you can't calculate true utilization or true cost per project. Non-billable categories: pitching, training, internal projects, admin, leave. Each gets its own bucket; don't lump them together.
- How often should I review utilization?
- Weekly with team leads, monthly at the leadership level. Daily is too noisy for staffing decisions; quarterly is too late to react. The right cadence catches under-utilization before it shows up in cash flow.
- When do we need a real PSA tool instead of Excel?
- Around 15–20+ billable people, or when project tracking lives in 3+ systems. Productive, Forecast, Float, Mavenlink, Harvest + Forecast, and Resource Guru all replace the spreadsheet for agencies.
More dashboards templates
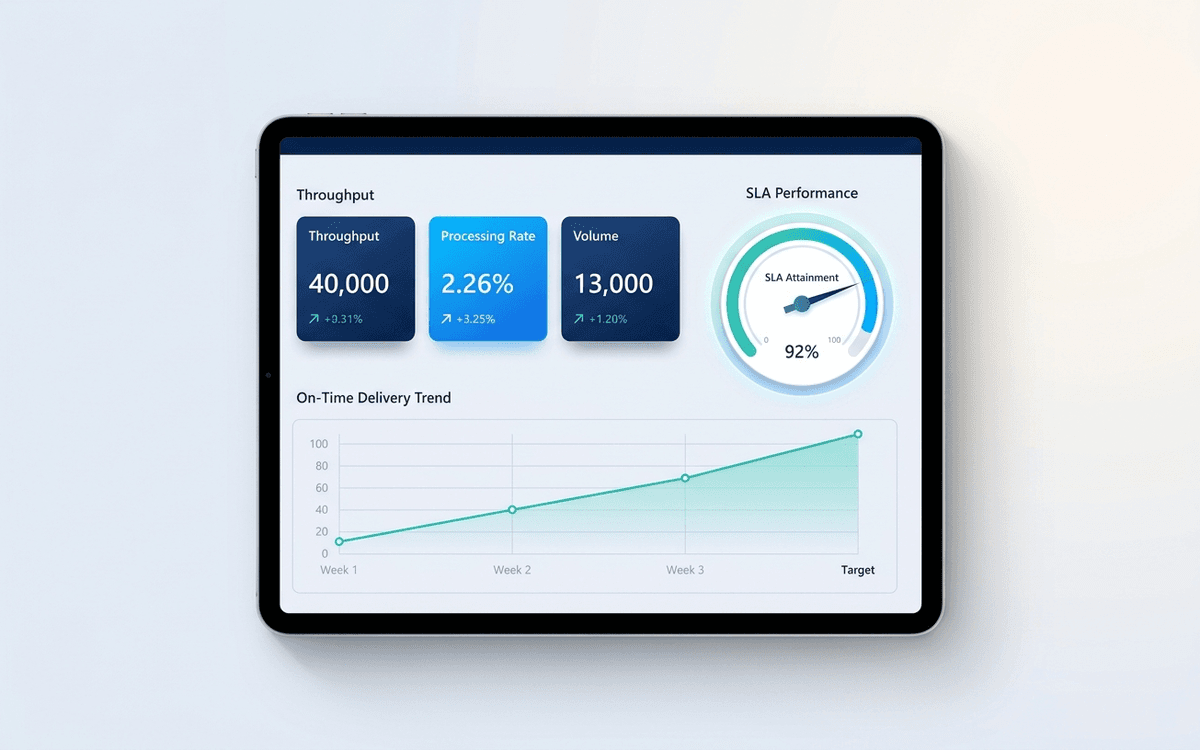
Operations Dashboard Template
An operations dashboard template that tracks the levers operators actually pull — throughput, SLA attainment, quality, capacity utilization, and on-time delivery — in a one-page weekly review format.
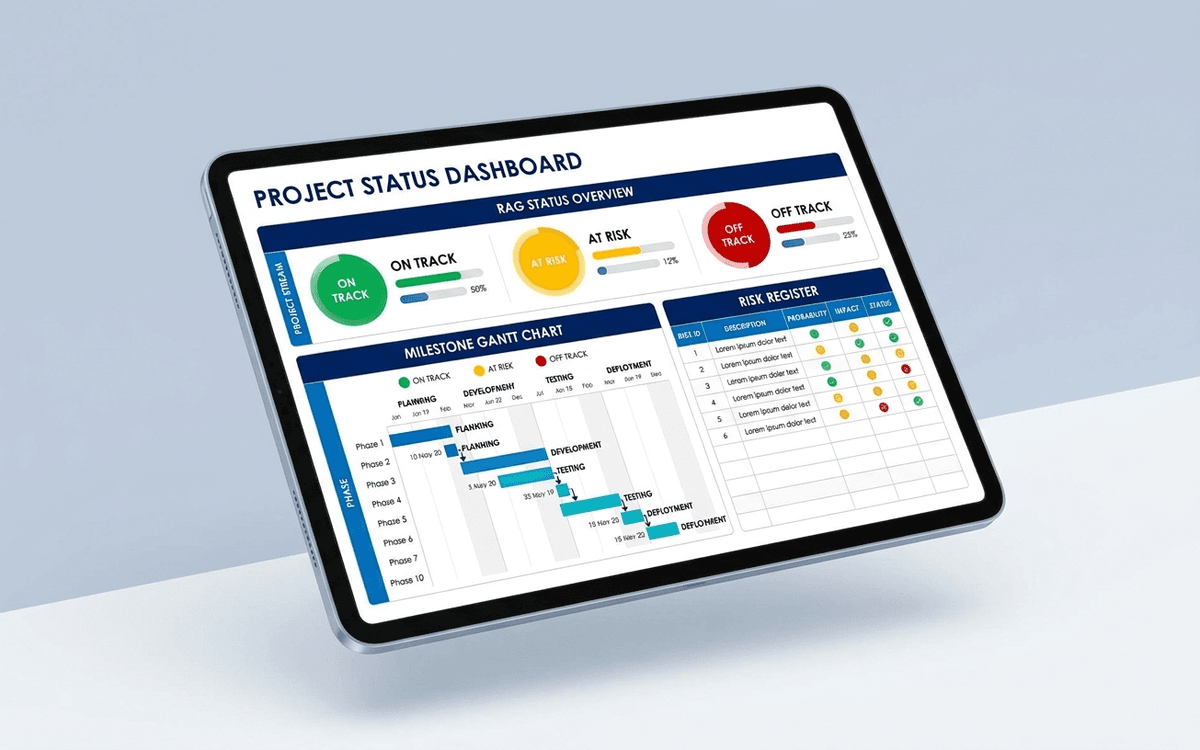
Project Status Dashboard Template
A project status dashboard template that surfaces what stakeholders actually want to know — milestone progress, RAG status, budget variance, and the top three risks — in a one-page weekly status report that doesn't take an hour to update.
When the template isn't enough
AppDeck's dashboards portal turns this template into a live workspace — version control, permissions, signatures, and analytics built in.