
What is a Executive Dashboard?
An executive dashboard is a real-time data visualization tool that presents key performance indicators and business metrics to leadership teams. It consolidates data from multiple sources into a single view so executives can monitor organizational health at a glance. Well-designed dashboards enable faster, data-driven decision-making.
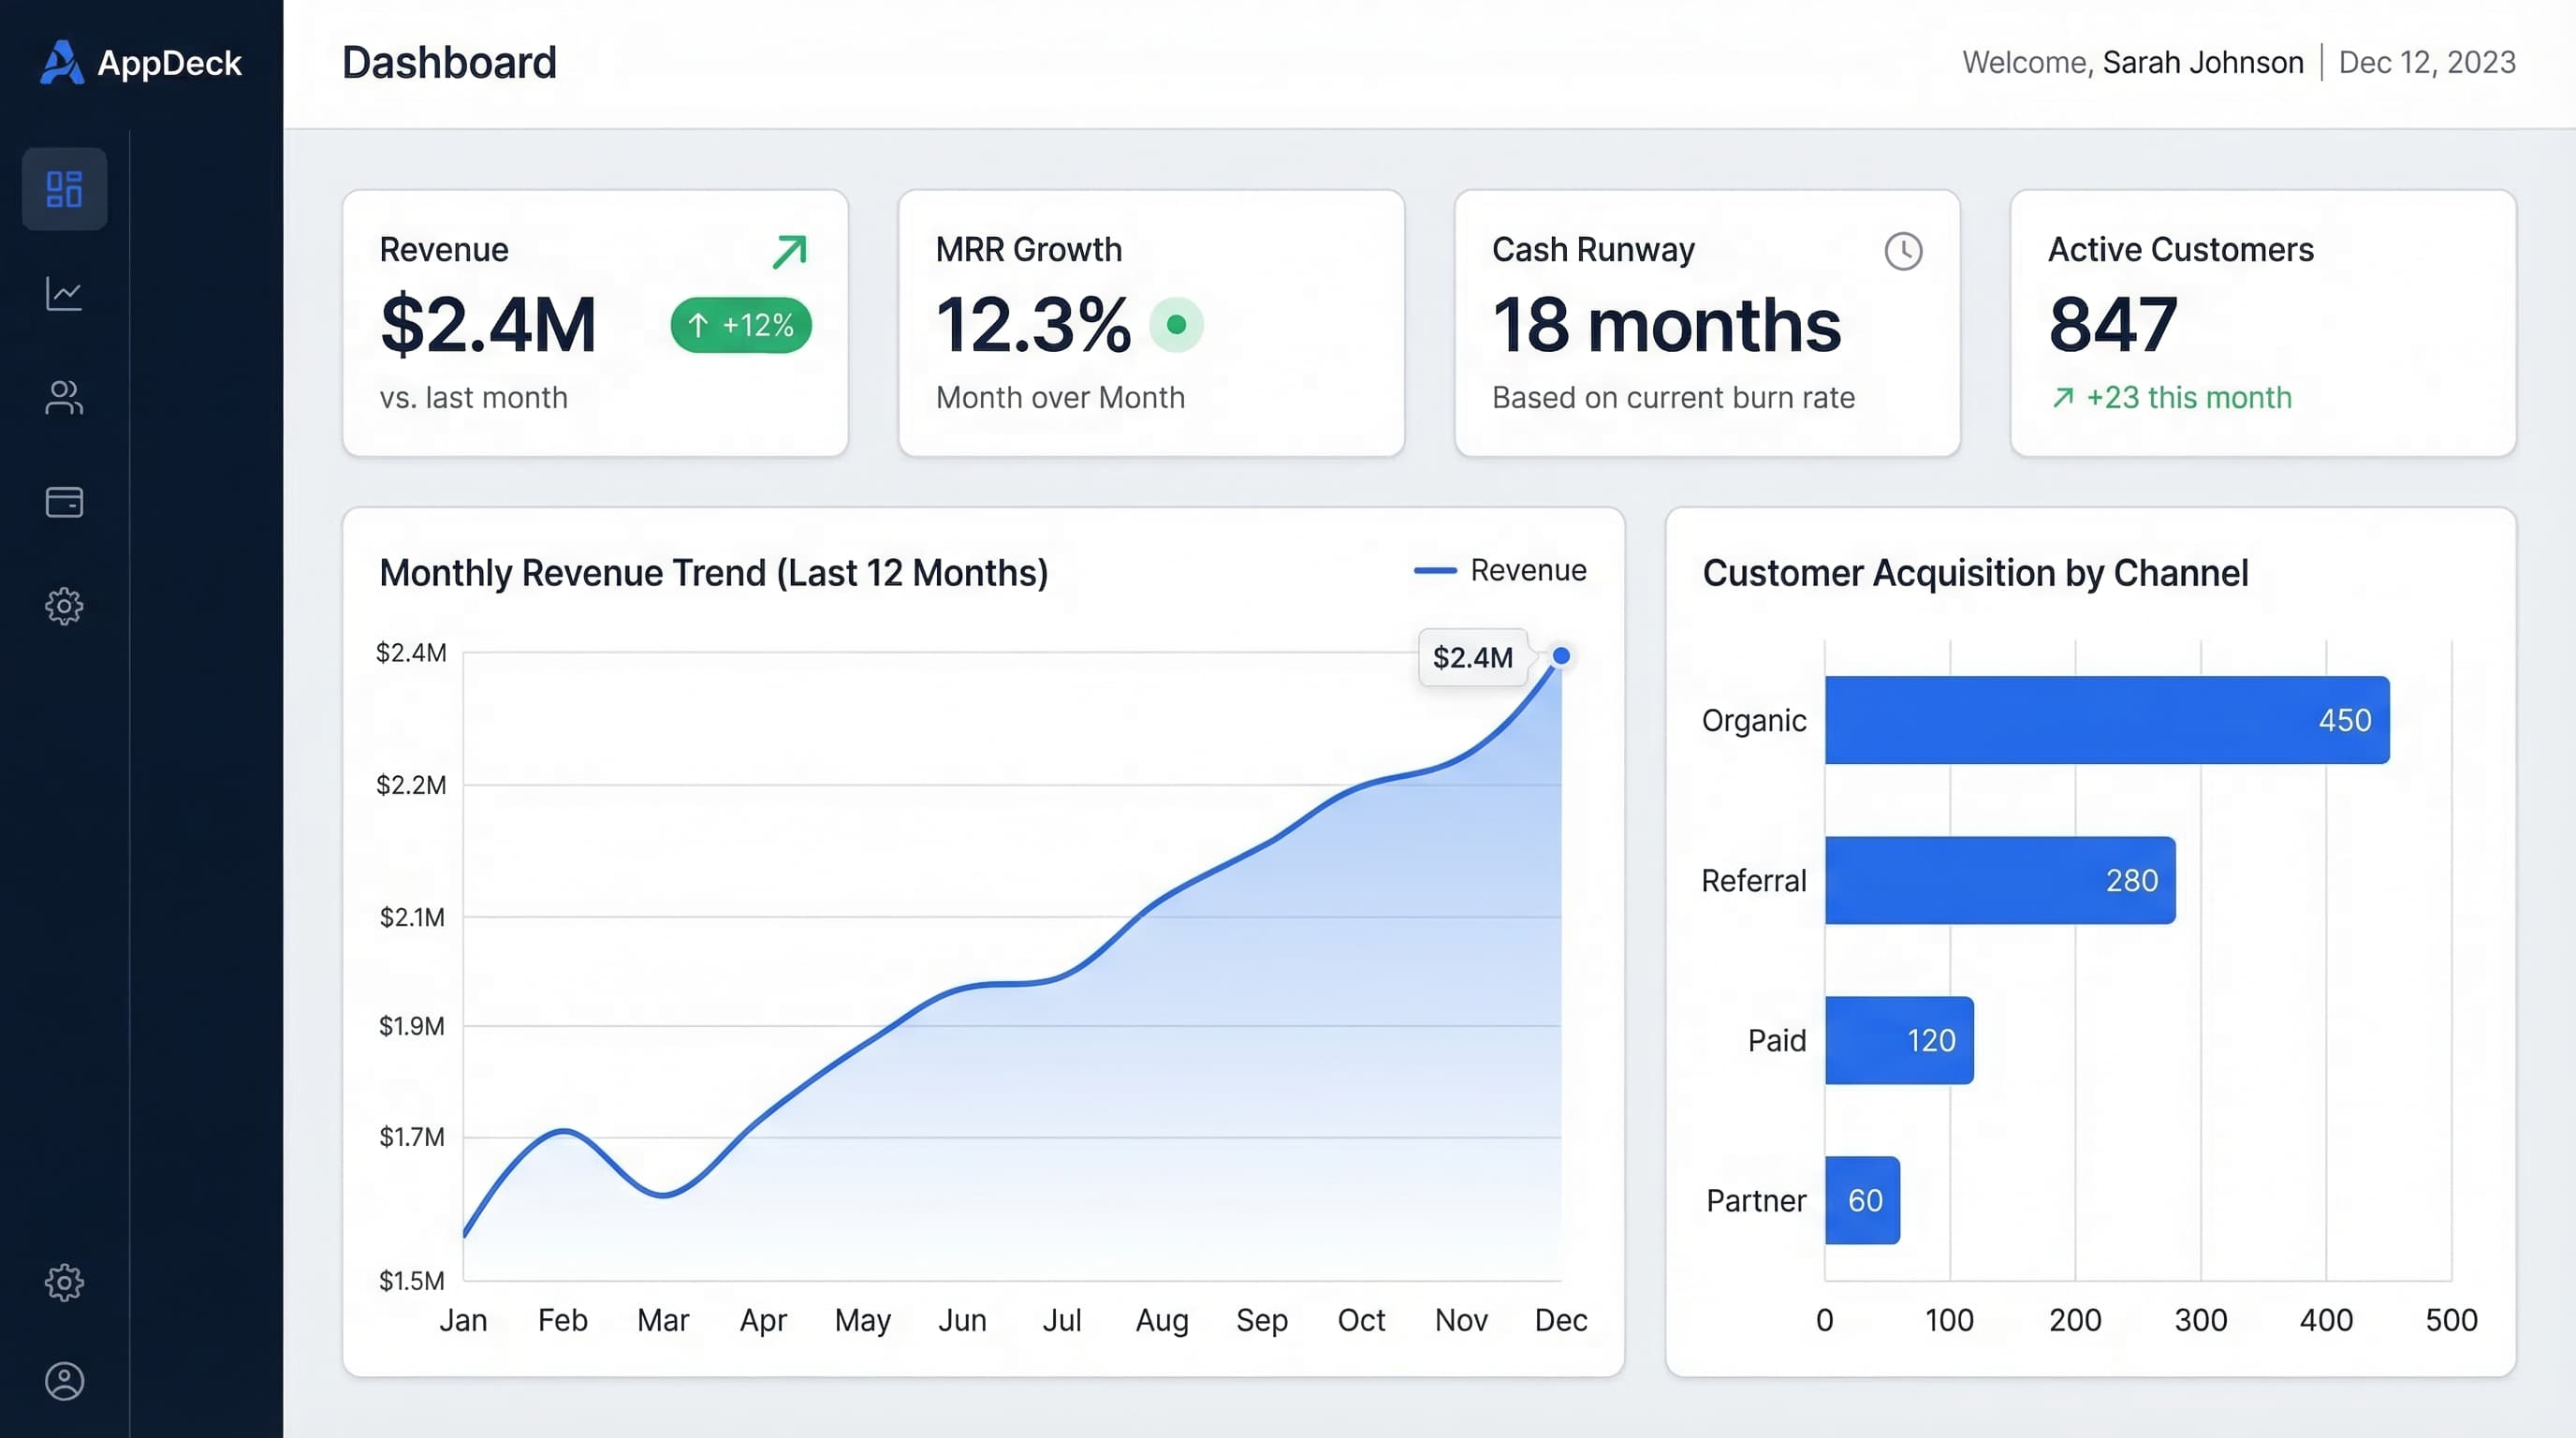
Executive dashboards distill complex business data into visual summaries that leaders can absorb in seconds. Revenue trends, customer acquisition costs, employee headcount, and operational efficiency metrics all appear on a single screen, updated automatically from underlying data sources. Color-coded thresholds and trend arrows make it easy to spot areas that need attention.
The best executive dashboards are role-specific. A CEO dashboard might emphasize revenue growth and strategic milestones, while a CFO dashboard focuses on cash flow, burn rate, and budget variance. A COO dashboard could highlight operational throughput and SLA compliance. This personalization ensures every leader sees the metrics most relevant to their responsibilities.
Integration is what separates a useful dashboard from a static report. By connecting to ERP systems, CRMs, financial platforms, and project management tools, the dashboard stays current without manual data entry. Drill-down capabilities let executives click into any metric to explore the underlying data, bridging the gap between high-level oversight and detailed analysis.
Key Features
Common Use Cases
- 1CEOs monitoring revenue growth and strategic OKRs
- 2CFOs tracking cash flow, burn rate, and budget variance
- 3COOs measuring operational throughput and SLA compliance
- 4Board members reviewing quarterly performance summaries
- 5Startup founders sharing metrics with investors
Related Terms
Board Portal
A board portal is a secure digital platform that streamlines board governance by centralizing meeting materials, resolutions, and voting. It replaces paper board books and email chains with role-based access, audit trails, and real-time collaboration. Organizations use board portals to improve transparency, accelerate decision-making, and maintain compliance.
Investor Data Room
An investor data room, also called a virtual data room (VDR), is a secure online repository for sharing confidential documents during fundraising, due diligence, and M&A transactions. It provides granular access controls, watermarking, and detailed activity tracking to protect sensitive information. Startups and enterprises alike use data rooms to streamline capital-raising processes.
Ready to Get Started?
Launch your portal in 30 minutes. Choose a portal type and see it in action.